Simple Linear Regression - PowerPoint PPT Presentation

1 / 24
Title: Simple Linear Regression
1
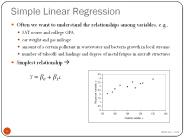
Simple Linear Regression
- Example - mammals
- Response variable gestation (length of
pregnancy) days - Explanatory brain weight
2
Man
- Extreme negative residual but that residual is
not statistically significant. - The extreme brain weight of man creates high
leverage that is statistically significant.
3
Man
- Is the point for Man influencing where the
simple linear regression line is going? - Is this influence statistically significant?
4
(No Transcript)
5
Simple Linear Regression
- Predicted Gestation 85.25 0.30Brain Weight
- R2 0.372, so only 37.2 of the variation in
gestation is explained by the linear relationship
with brain weight.
6
Exclude Man
- What happens to the simple linear regression line
if we exclude Man from the data? - Do the estimated intercept and estimated slope
change?
7
(No Transcript)
8
Simple Linear Regression
- Predicted Gestation 62.05 0.634Brain Weight
- R2 0.600, 60 of the variation in gestation is
explained by the linear relationship with brain
weight.
9
Changes
- The estimated slope has more than doubled once
Man is removed. - The estimated intercept has decreased by over 20
days.
10
Influence
- It appears that the point associated with Man
influences where the simple linear regression
line goes. - Is this influence statistically significant?
11
Influence Measures
- Quantifying influence involves how much the point
differs in the response direction as well as in
the explanatory direction. - Combine information on the residual and the
leverage.
12
Cooks D
- where z is the standardized residual and k is the
number of explanatory variables in the model.
13
Cooks D
- If D gt 1, then the point is considered to have
high influence.
14
Cooks D for Man
15
Cooks D for Man
- Because the D value for Man is greater than 1,
it is considered to exert high influence on where
the regression line goes.
16
Cooks D
- There are no other mammals with a value of D
greater than 1. - The okapi has D 0.30
- The Brazilian Tapir has D 0.10
17
Studentized Residuals
- The studentized residual is the standardized
residual adjusted for the leverage.
18
Studentized Residuals
z h rs
Brazilian Tapir 3.010 0.0217 3.043
Man 2.516 0.6612 4.323
Okapi 2.443 0.0839 2.552
19
Studentized Residuals
- If the conditions for the errors are met, then
studentized residuals have an approximate
t-distribution with degrees of freedom equal to n
k 1.
20
Computing a P-value
- JMP Col Formula
- (1 t Distribution(rs,n-k-1))2
- For our example
- rs 3.043, n-k-148
- P-value 0.0038
21
Studentized Residuals
z h rs P-value
Brazilian Tapir 3.010 0.0217 3.043 0.0038
Man 2.516 0.6612 4.323 lt0.0001
Okapi 2.443 0.0839 2.552 0.0139
22
Conclusion Man
- The P-value is much less than 0.001 (the
Bonferroni corrected cutoff), therefore Man has
statistically significant influence on where the
regression line is going.
23
Other Mammals
- The Brazilian Tapir has the most extreme
standardized residual but not much leverage and
so is not influential according to either Cooks
D or the Studentized Residual value.
24
Other Mammals
- The Okapi has high leverage, greater than 0.08,
but its standardized residual is not that
extreme and so is not influential according to
either Cooks D or the Studentized Residual value.
Recommended
CrystalGraphics Presentations