
Reasoning in Psychology Using Statistics - PowerPoint PPT Presentation
Title:
Reasoning in Psychology Using Statistics
Description:
Using Statistics Psychology 138 ... Review lecture notes and labs Re-read the Reading packet Do practice problems ... Social Science Reasoning Using Statistics – PowerPoint PPT presentation
Number of Views:254
Avg rating:3.0/5.0
Title: Reasoning in Psychology Using Statistics
1
Reasoning in PsychologyUsing Statistics
- Psychology 138
- 2015
2
Exam 3 review Inferential Statistics
- Distribution of sample means
- Standard error
- Central limit theorem
- Hypothesis testing
- Test statistics
- 1-sample z
- 1-sample t
- Related sample t
- Independent sample t
- 5 step program
- Hypotheses
- Null and Alternative
- 1 or 2 tailed
- Error types
- p(Type I error) a alpha
- p(Type II error) ß beta
- Reaching a conclusion
- Reject the H0
- Fail to reject H0
3
Inferential statistics
- Hypothesis testing
- Testing claims about populations (and the effect
of variables) based on data collected from
samples - Using estimates of the sampling error (expected
difference between the sample statistics and the
population parameters)
4
Properties of the distribution of sample means
5
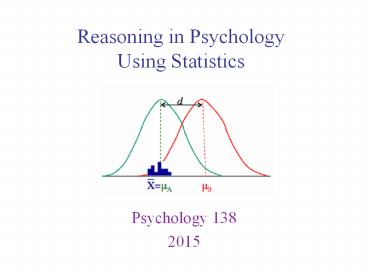
Properties of the distribution of sample means
Standard error
the average amount a
sample mean (of a particular sample size) will
differ from the population mean.
Used as our difference expected by chance in our
test statistics.
6
Properties of the distribution of sample means
Standard error
the average amount a
sample mean (of a particular sample size) will
differ from the population mean.
Used as our difference expected by chance in our
test statistics.
7
Performing your inferential statistics
- Analyze the question/problem.
- The design of the research how many groups, how
many scores per person, is the population s
known, etc.
- Write out what information is given
- Means, standard deviations, number of subjects,
a-level, etc. - Is it asking you to test a difference or make an
estimate? - If hypothesis test
- What are the H0 and HA?
- 1-tailed or 2-tailed hypotheses?
- What is your critical value of your test
statistic (z or t from table, youll need youre
a-level)
8
Performing your inferential statistics
- Analyze the question/problem.
- Now you are ready to do some computations
- Write out all of the formulas that youll need
9
Performing your inferential statistics
- Analyze the question/problem.
- Now you are ready to do some computations
- Draw a Conclusion and Interpret your final answer
- Reject or fail to reject the null hypothesis?
10
Performing your inferential statistics
- Analyze the question/problem.
- Now you are ready to do some computations
- Draw a Conclusion and Interpret your final answer
- Reject or fail to reject the null hypothesis?
Distribution of the t-statistic or z-statistic
Evidence suggests that the treatment has an
effect
Evidence suggests that the treatment has no
effect
11
Hypothesis testing formulas summary
(Estimated) Standard error
df
Design
Test statistic
One sample, s known
One sample, s unknown
Two related samples, s unknown
Two independent samples, s unknown
12
How do I study for this test?
- The usual
- Review lecture notes and labs
- Re-read the Reading packet
- Do practice problems
- Remember to ask yourself conceptual questions
- e.g., What would happen to my standard error
if I increased my sample size? - Make Flash Cards of problems
13
Make your flash cards
- Dr. Mnemonic develops a new treatment for
patients with a memory disorder. He isnt
certain what impact, if any, it will have. To
test it he randomly assigns 8 patients to one of
two samples. He then gives one sample (A) the
new treatment but not the other (B) and then
tests both groups with a memory test. Use a
0.05.
Independent samples t-test
Two tailed any impact
Fail to Reject H0
Evidence suggests that the treatment has no effect
14
Make your flash cards
15
Make your flash cards
- Dr. Psychic examined the performance of 28
students who answered multiple-choice items on
the SAT test without having read the passages to
which the items referred. The mean score was
46.6 (out of 100), with a standard deviation of
6.8. Test whether these students performed
different than chance (chance performance would
result in 20 correct scores) with an a-level
0.01.
16
In labs
- Practice determining which statistical test is
appropriate for a number of different situations,
and carrying out that test (practice by hand and
using SPSS).
Recommended
CrystalGraphics Presentations


