
Homework 6: Correlation and Regression - PowerPoint PPT Presentation
1 / 10
Title:
Homework 6: Correlation and Regression
Description:
Homework 6: Correlation and Regression What is the strength of the relationship between two variables? What statistical test to use? See pg 25 of lab manual ... – PowerPoint PPT presentation
Number of Views:114
Avg rating:3.0/5.0
Title: Homework 6: Correlation and Regression
1
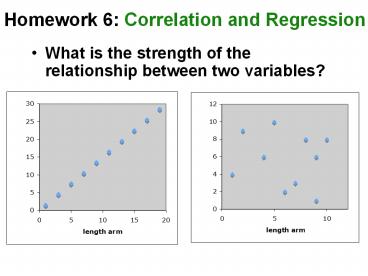
Homework 6 Correlation and Regression
- What is the strength of the relationship between
two variables?
2
What statistical test to use?See pg 25 of
lab manual
3
Correlation
- No cause-and-effect
- No independent and dependent variables
- Variable axes are interchangable
- Statistic r
- ranges from -1 to 1
- 0 no relationship
- -1 or 1 perfect relationship
4
Homework 6 Correlation and Regression
- What is the strength of the relationship between
two variables?
r 0
r 1.0
5
What is the strength of the relationship between
two variables?
6
Regression 1
- Cause-and-effect
- Independent (x-axis) and dependent
- (y-axis)
- Statistic R2
- Ranges from 0 - 1
- 0 no cause-and-effect
- 1 perfect cause-and-effect
7
What is the strength of the relationship between
two variables?
R2 0.99 r2
8
Regression 2
- Generates a line to best represent points
- Can use linear equation to predict
- y from x
- y a bx a y-intercept b slope
9
An example
Background Winters have been getting
warmer. Warmer air holds more moisture -- gt
snow. Does amount of snow predict robin arrival?
10
If robins cue their upward migration on warm
temperatures,then robins will arrive earlier in
years with greater snowfall.Assumption
Warmer winters have greater snowfall.Go
to Excel