
Financial Accounting and Accounting Standards - PowerPoint PPT Presentation
Title:
Financial Accounting and Accounting Standards
Description:
Identify and compute ratios used in analyzing a firm s liquidity, profitability, and solvency. Understand the concept of earning power, ... – PowerPoint PPT presentation
Number of Views:153
Avg rating:3.0/5.0
Title: Financial Accounting and Accounting Standards
1
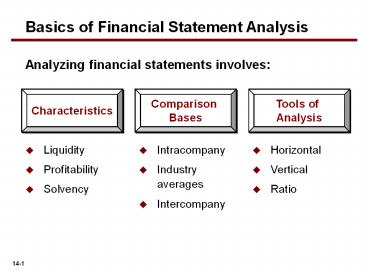
Basics of Financial Statement Analysis
Analyzing financial statements involves
Characteristics
Comparison Bases
Tools of Analysis
- Liquidity
- Profitability
- Solvency
- Intracompany
- Industry averages
- Intercompany
- Horizontal
- Vertical
- Ratio
2
Horizontal Analysis
- Horizontal analysis, also called trend analysis,
is a technique for evaluating a series of
financial statement data over a period of time. - Purpose is to determine the increase or decrease
that has taken place. - Commonly applied to the balance sheet, income
statement, and statement of retained earnings.
3
Horizontal Analysis
Illustration 14-5 Horizontal analysis of balance
sheets
Changes suggest that the company expanded its
asset base during 2009. It financed this
expansion primarily by retaining income rather
than assuming additional long-term debt.
4
Horizontal Analysis
Illustration 14-6 Horizontal analysis of Income
statements
Overall, gross profit and net income were up
substantially. Gross profit increased 17.1,
and net income, 26.5. Qualitys profit trend
appears favorable.
5
Vertical Analysis
- Vertical analysis, also called common-size
analysis, is a technique that expresses each
financial statement item as a percent of a base
amount. - On an income statement, we might say that selling
expenses are 16 of net sales. - Vertical analysis is commonly applied to the
balance sheet and the income statement.
6
Vertical Analysis
Illustration 14-8 Vertical analysis of balance
sheets
These results reinforce that the company is
financing its growth through operations and not
through issuing additional debt.
7
Vertical Analysis
Illustration 14-9 Vertical analysis of Income
statements
Company appears to be a profitable enterprise
that is becoming even more successful.
8
Ratio Analysis
Ratio analysis expresses the relationship among
selected items of financial statement data.
Financial Ratio Classifications
Liquidity
Profitability
Solvency
Measures short-term ability of the company to pay
its maturing obligations and to meet unexpected
needs for cash.
Measures the income or operating success of a
company for a given period of time.
Measures the ability of the company to survive
over a long period of time.
9
Ratio Analysis
A single ratio by itself is not very meaningful.
The discussion of ratios will include the
following types of comparisons.
10
Ratio Analysis
Liquidity Ratios
Measures short-term ability of the company to pay
its bills-debt and to meet unexpected cash needs.
Specific ratios include
- Current ratio (can I pay upcoming bills),
11
Liquidity Ratios
Ratio Analysis
1. Current Ratio
Ratio means that for every dollar of current
liabilities, Quality has 2.96 of current assets.
12
Ratio Analysis
Liquidity Ratios
Measures short-term ability of the company to pay
its bills-debt and to meet unexpected cash needs.
Specific ratios include
- Current ratio (can I pay upcoming bills),
- Acid-test ratio (more refined than current
ratio)
13
Liquidity Ratios
Ratio Analysis
2. Acid-Test Ratio
Illustration 14-13
14
Liquidity Ratios
Ratio Analysis
2. Acid-Test Ratio
Measures immediate liquidity.
15
Ratio Analysis
Liquidity Ratios
Measures short-term ability of the company to pay
its bills-debt and to meet unexpected cash needs.
Specific ratios include
- Current ratio (can I pay upcoming bills),
- Acid-test ratio (more refined than current
ratio) - Receivable turnover (how quick do I collect )
16
Liquidity Ratios
Ratio Analysis
3. Receivable Turnover
17
Liquidity Ratios
Ratio Analysis
Receivable Turnover
2,097,000
10.2 times
(180,000 230,000) / 2
A variant of the Receivable turnover ratio is to
convert it to an average collection period in
terms of days.
365 days / 10.2 times every 35.78 days
Receivables are collected on average every 36
days.
18
Ratio Analysis
Liquidity Ratios
Measures short-term ability of the company to pay
its bills-debt and to meet unexpected cash needs.
Specific ratios include
- Current ratio (can I pay upcoming bills),
- Acid-test ratio (more refined than current
ratio) - Receivable turnover (how quick do I collect )
- Inventory turnover (effectiveness of company).
19
Liquidity Ratios
Ratio Analysis
4. Inventory Turnover
Illustration 14-16
Measures the number of times, (on average), the
inventory is sold during the period.
20
Liquidity Ratios
Ratio Analysis
Inventory Turnover
1,281,000
2.3 times
(500,000 620,000) / 2
A variant of inventory turnover is the days in
inventory.
365 days / 2.3 times every 159 days
Inventory turnover ratios vary considerably among
industries.
21
Ratio Analysis
Profitability Ratios
Measure the income or operating success of a
company for a given period of time. Ratios
include
- Profit margin
22
Profitability Ratios
Ratio Analysis
5. Profit Margin
Measures the percentage of each dollar of sales
that results in net income.
23
Ratio Analysis
Profitability Ratios
Measure the income or operating success of a
company for a given period of time. Ratios
include
- Profit margin
- Asset turnover
24
Profitability Ratios
Ratio Analysis
6. Asset Turnover
Measures how efficiently a company uses its
assets to generate sales.
25
Ratio Analysis
Profitability Ratios
Measure the income or operating success of a
company for a given period of time. Ratios
include
- Profit margin
- Asset turnover
- Return on assets
26
Profitability Ratios
Ratio Analysis
7. Return on Asset
An overall measure of profitability.
27
Ratio Analysis
Profitability Ratios
Measure the income or operating success of a
company for a given period of time. Ratios
include
- Profit margin
- Asset turnover
- Return on assets
- Return on common stockholders equity
28
Profitability Ratios
Ratio Analysis
8. Return on Common Stockholders Equity
Illustration 14-20
Shows how many dollars of net income company
earned for each dollar invested by owners.
29
Ratio Analysis
Profitability Ratios
Measure the income or operating success of a
company for a given period of time. Ratios
include
- Profit margin
- Asset turnover
- Return on assets
- Return on common stockholders equity
- Earnings per share
30
Profitability Ratios
Ratio Analysis
9. Earnings Per Share (EPS)
A measure of the net income earned on each share
of common stock.
31
Ratio Analysis
Profitability Ratios
Measure the income or operating success of a
company for a given period of time. Ratios
include
- Profit margin
- Asset turnover
- Return on assets
- Return on common stockholders equity
- Earnings per share
- Price to earnings ratio
32
Profitability Ratios
Ratio Analysis
10. Price-Earnings Ratio
Measures the net income earned on each share of
common stock.
33
Ratio Analysis
Profitability Ratios
Measure the income or operating success of a
company for a given period of time. Ratios
include
- Profit margin
- Asset turnover
- Return on assets
- Return on common stockholders equity
- Earnings per share
- Price to earnings ratio
- Payout ratio
34
Profitability Ratios
Ratio Analysis
11. Payout Ratio
Measures the percentage of earnings distributed
in the form of cash dividends.
35
Ratio Analysis
Solvency Ratios
- Solvency ratios measure the ability of a company
to survive over a long period of time. Ratios
include - Debt to Total Assets
36
Solvency Ratios
Ratio Analysis
12. Debt to Total Assets Ratio
Measures the percentage of the total assets that
creditors provide.
37
Ratio Analysis
Solvency Ratios
- Solvency ratios measure the ability of a company
to survive over a long period of time. Ratios
include - Debt to Total Assets
- Times Interest Earned
38
Solvency Ratios
Ratio Analysis
13. Times Interest Earned
Indicates ability of the company to meet interest
payments as they come due.
39
Ratio Analysis
Summary of Ratios
Illustration 14-26
40
Summary of Ratios
Illustration 14-26
41
Earning Power and Irregular Items
- Earning power means the normal level of income to
be obtained in the future. - Irregular items are separately identified on
the income statement. Two types are - Discontinued operations.
- Extraordinary items.
42
Earning Power and Irregular Items
Discontinued Operations
- Disposal of a significant component of a
business. - Report the income (loss) from discontinued
operations in two parts - income (loss) from operations (net of tax) and
- gain (loss) on disposal (net of tax).
43
Earning Power and Irregular Items
Illustration During 2014 BD Incorporated Has
income before taxes of 79,000,000.
Discontinued and sold its unprofitable chemical
division. Loss from chemical operations (net of
135,000 taxes) was 315,000. Loss on disposal
of the chemical division (net of 81,000 taxes)
was 189,000. (Assume a 30 tax rate on income).
44
Earning Power and Irregular Items
Discontinued Operations are reported after
Income from continuing operations.
Previously labeled as Net Income.
Moved to
45
Earning Power and Irregular Items
Extraordinary Items
- Nonrecurring material items that differ
significantly from a companys typical business
activities. - Must be both of an
- Unusual Nature and
- Occur Infrequently.
- Must consider the environment in which it
operates. - Amounts reported net of tax.
46
Earning Power and Irregular Items
Illustration In 2014 a foreign government
expropriated property held as an investment by DB
Inc. If the loss is 770,000 before income
taxes of 231,000, the income statement will
report a deduction of 539,000.
47
Earning Power and Irregular Items
Extraordinary Items are reported after Income
from continuing operations.
Previously labeled as Net Income.
Moved to
48
Earning Power and Irregular Items
Reporting when both Discontinued Operations
and Extraordinary Items are present.
Discontinued Operations
Extraordinary Item
49
Earning Power and Irregular Items
Change in Accounting Principle
- Occurs when the principle used in the current
year is different from the one used in the
preceding year. - Accounting rules permit a change if justified.
- Changes are reported retroactively.
- Example would include a change in inventory
costing method such as FIFO to average cost.
50
Earning Power and Irregular Items
Comprehensive Income
All changes in stockholders equity except those
resulting from investments by stockholders and
distributions to stockholders.
Reported in Stockholders Equity
- Unrealized gains and losses on available-for-sale
securities. - Plus other items
51
Earning Power and Irregular Items
Comprehensive Income
- Why are gains and losses on available-for-sale
securities excluded from net income? - Because disclosing them separately
- reduces the volatility of net income due to
fluctuations in fair value, - yet informs the financial statement user of the
gain or loss that would be incurred if the
securities were sold at fair value.
52
Quality of Earnings
A company that has a high quality of earnings
provides full and transparent information that
will not confuse or mislead users of the
financial statements.
- Companies have incentives to manage income to
meet or beat Wall Street expectations, so that - the market price of stock increases and
- the value of stock options increase.
Recommended
CrystalGraphics Presentations


