
Introduction to Differential Equations - PowerPoint PPT Presentation
1 / 10
Title:
Introduction to Differential Equations
Description:
Regression and Correlation of Data Summary Procedures for regression: 1. Assume a regression equation. 2. If the equation is simple linear form, use least squares ... – PowerPoint PPT presentation
Number of Views:178
Avg rating:3.0/5.0
Title: Introduction to Differential Equations
1
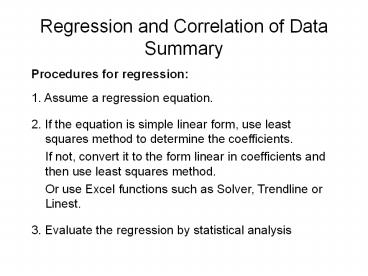
Regression and Correlation of DataSummary
Procedures for regression 1. Assume a
regression equation. 2. If the equation is
simple linear form, use least squares method to
determine the coefficients. If not, convert it
to the form linear in coefficients and then use
least squares method. Or use Excel functions
such as Solver, Trendline or Linest. 3. Evaluate
the regression by statistical analysis
2
Regression and Correlation of DataSummary
Simple Linear Regression
Method of Least Squares a and b are determined
by minimizing the sum of the squares of errors
(SSE), deviation, residuals or difference between
the data set and the straight line that
approximate it.
3
Regression and Correlation of DataSummary
Centroidal point
4
Regression and Correlation of DataSummary
Procedures for regression 1. Assume a
regression equation. 2. If the equation is
simple linear form, use least squares method to
determine the coefficients. If not, convert it
to the form linear in coefficients and then use
least squares method. Or use Excel functions
such as Solver, Trendline or Linest. 3. Evaluate
the regression by statistical analysis
5
Regression and Correlation of DataSummary
Forms transformable to linear in coefficients
e.g.
Other forms linear in coefficients e.g.
Use least square method to determine the
coefficients.
Convert the equation to the form containing the
original variables.
6
Regression and Correlation of DataSummary
Procedures for regression 1. Assume a
regression equation. 2. If the equation is
simple linear form, use least squares method to
determine the coefficients. If not, convert it
to the form linear in coefficients and then use
least squares method. Or use Excel functions
such as Solver, Trendline or Linest. 3. Evaluate
the regression by statistical analysis
7
Regression and Correlation of DataSummary
Statistical analysis of the regression
Sum of the squares of errors (SSE),
Estimated standard deviation or standard error
of the points from the line
Estimated variance of the points from the line
The degrees of freedomn data points the number
of estimated coefficients
8
Regression and Correlation of Data Summary
Correlation Coefficient
r 1 the points (xi,yi) are in a perfect
straight line and the slope of that line is
positive r -1 the points (xi,yi) are in a
perfect straight line and the slope of that line
is negative r close to 1 or -1 X and Y follow
a linear relation affected by random
errors. r0 there is no systematic linear
relation between X and Y.
9
Regression and Correlation of DataSummary
Coefficient of determination
The coefficient of determination is the fraction
of the sum of squares of deviations in the
y-direction from is explained by the linear
relation between y and x given by regression.
10
Regression and Correlation of DataSummary
Statistical analysis of the regression
Residuals (also used for graphical checks)
Percentage Error
Absolute Percentage Error