
Chapter 8 Cost Advantage PowerPoint PPT Presentation
1 / 16
Title: Chapter 8 Cost Advantage
1
Chapter 8 Cost Advantage
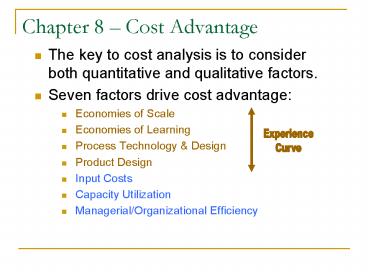
- The key to cost analysis is to consider both
quantitative and qualitative factors. - Seven factors drive cost advantage
- Economies of Scale
- Economies of Learning
- Process Technology Design
- Product Design
- Input Costs
- Capacity Utilization
- Managerial/Organizational Efficiency
Experience Curve
2
The Experience Curve
- Generalized by BCG to encompass not just direct
labor hours, but the behavior of all added costs
with cumulative production. - If costs decline systematically with increases in
cumulative output, then the experience curve
implies that a firms primary strategic goal
should be market share. - However, there are some doubts about this
strategy
3
The Experience Curve
- Difficulties in interpreting the experience curve
and market share as a strategy - Association is not the same as causality Which
comes first market share or superior profits?
Most likely they are the consequence of some
underlying factor (E,Q, I). - The reduced profitability of pursuing market
share if all firms pursue this strategy, then
superior profitability will be eroded.
Overinvestment in this strategy and aggressive
pricing may even result in industry wide losses.
4
Experience Curve Economies of Scale
- Conventionally associated with manufacturing.
- Can also be important in purchasing, RD,
distribution, and advertising. - Scale economies are derived from 3 sources
- Technical input-output relationships increases
in output do not require proportionate increases
in input - Indivisibilities lumpy resources that are
unavailable in smaller sizes - Specialization promotes learning, avoids losses
from switching activities, assists in automation,
etc.
5
Experience Curve Economies of Scale
- Limits to Scale Economies
- Reluctance to fully exploit EOS is a result of 3
factors - Product differentiation the price premium of
targeting a single segment may outweigh the
higher cost of small volume production. - Flexibility huge facilities have greater
difficulty adjusting to changes in demand,
technology, input prices, and customization. - Motivation and coordination large units are
more complex and difficult to manage than smaller
units.
6
Experience Curve Economies of Learning
- May be the principal source of experience-based
cost reductions. - EOL decrease time required for particular tasks
and improve coordination between jobs. - The more complex a task (process or product), the
greater the potential for learning. - Learning occurs both at the individual level
through improvements in dexterity and problem
solving, and at the organizational level through
the development and refinement of organizational
routines (capabilities). - e.g. Time-in-motion studies
7
Experience Curve Process Technology and Design
- New product technology may radically reduce
costs. - When process innovation is embodied in new
capital equipment only, diffusion is likely to be
rapid. - The full benefits of new processes require
system-wide changes in job design, incentives,
organizational structure, and management
controls. - The greatest productivity gains from process
change are the result of organizational
improvements rather than technological
innovation. - JIT, TQM, quality circles, teamwork,
partnerships, etc
8
Process Innovation
- Reengineering
- Fundamental rethinking and radical redesign of
business processes to achieve dramatic
improvements in performance. - Business processes cut across functions
- Focus on processes rather than functions forces
firms to adopt a different approach - May result in RIFs or hiring
- Almost always changes scope of responsibilities
- Always requires change at the deepest level of
organizational culture
9
Implementing Strategic Change
- Reengineering and TQM go hand-in-hand
BPR
performance
TQM
BPR
TQM
Time
10
Experience Curve Product Design
- Design for manufacture designing products for
ease of production rather than just functionality
or aesthetics can offer substantial cost
savings. - To do this, the organizational functions must be
tightly linked RD, engineering, production,
marketing, etc.
11
EOS, Learning, Experience Curves
A
EOS
Unit Costs
Learning, Technology, Process/Product Design
B
Average Costs
C
Output
MES
12
Cost Advantage Capacity Utilization
- The ability to adjust capacity to the current
level of demand can be a major source of cost
advantage. - During periods of low demand, plant capacity is
underutilized. Unit costs increase because fixed
costs must be spread over the units of
production. Thus, firms with high fixed costs
are more sensitive to demand fluctuations. - Some firms try to manage upstream relationships
or use tapered vertical integration.
13
Cost Advantage Input Costs
- Differences in costs incurred by different firms
for similar inputs can be an important source of
cost advantage. - Locational differences wage rates, raw
materials, knowledge, exchange rates, etc. - Supply ownership VI or contracts
- Non-union labor costs and flexibility
- Bargaining power power of the buyer
14
Cost Advantages Residual Efficiency
- Even after taking aforementioned cost drivers
into accountthere are still firm differences. - Residual efficiency depends on a firms ability
to eliminate organizational slack the
inability of employees and managers to operate at
maximum efficiency. - Low levels of residual efficiency are typically
the result of an organizational culture and
management style that are tolerant toward
manifestations of unnecessary costs.
15
Using the Value Chain to Analyze Costs(The Fat
Arrow in Detail)
- Analyzing costs requires disaggregating the firms
value chain in order to identify - Relative importance of each activity with respect
to total cost - Cost drivers for each activity
- How costs in one activity influence costs in
another (holism) - Which activities should be undertaken within the
firm and which activities should be outsourced
16
Stages of Value Chain Analysis
- Disaggregate the firm into separate activities
subjective, but current structure may be a guide. - Establish the relative importance of activities
on the total cost of the product Activity-based
costing. - Compare costs by activity benchmark
- Identify cost drivers what factors determine
your level of cost relative to competition? - Identify linkages trace defects to their source
(TQM) - Identify opportunities for reducing costs if
EOS applies, can volume be increased can wages
be decreased outsourcinginsourcing?
Recommended
