

Template for SIP Forum Briefings Page One 45 Minute Presentations PowerPoint PPT Presentation
1 / 10
Title: Template for SIP Forum Briefings Page One 45 Minute Presentations
1
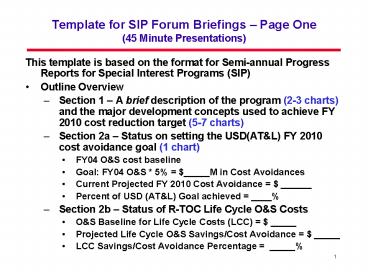
Template for SIP Forum Briefings Page One(45
Minute Presentations)
- This template is based on the format for
Semi-annual Progress Reports for Special Interest
Programs (SIP) - Outline Overview
- Section 1 A brief description of the program
(2-3 charts) and the major development concepts
used to achieve FY 2010 cost reduction target
(5-7 charts) - Section 2a Status on setting the USD(ATL) FY
2010 cost avoidance goal (1 chart) - FY04 OS cost baseline
- Goal FY04 OS 5 _____M in Cost Avoidances
- Current Projected FY 2010 Cost Avoidance
______ - Percent of USD (ATL) Goal achieved ____
- Section 2b Status of R-TOC Life Cycle OS Costs
- OS Baseline for Life Cycle Costs (LCC) _____
- Projected Life Cycle OS Savings/Cost Avoidance
_____ - LCC Savings/Cost Avoidance Percentage _____
2
Template for SIP Forum Briefings Page Two(45
Minute Presentations)
- This template is based on the format for
Semi-annual Progress Reports for Special Interest
Programs (SIP) - Outline Overview Continued
- Section 3 Describe projects initiated to meet
the Goal (charts as required) - Section 4 Lessons Learned to be shared with
other programs - (charts as required) - Section 5 Respond to Forum Questions as
appropriate - (charts as required)
3
Program Name(Title slide for briefing)
- Program logo
- Photo of system
- Briefer name and job title
- Date
4
Section 1 Program Description
- Part 1
- Brief Program description and changes in program
since last briefing 2-3 charts, 5 to 10 minutes
max - Part 2
- Describe the major R-TOC development concepts for
your program 5-7 charts as needed
5
Section 2 USD(ATL) FY 2010 Goal
- Calculation of USD(ATL) FY 2010 Cost Reduction
Goal - FY 2004 OS cost baseline _____
- Goal FY 2004 OS cost 5 _____
- Current status on meeting the USD(ATL) FY 2010
Goal - Current projected cost avoidance in FY 2010
_____ - Percent of USD(ATL) goal achieved _____
- Life Cycle Reporting
- OS Baseline for Life Cycle Costs (LCC) _____
- Projected Life Cycle OS Savings/Cost Avoidance
_____ - LCC Savings/Cost Avoidance Percentage _____
- One chart
6
Section 3 R-TOC Projects
- Describe the R-TOC projects you have initiated to
meet your cost avoidance goal - Use 4-panel quad charts for each project (see
following charts) - As many charts as needed
7
R-TOC Projects (2)
- Display R-TOC projects using quad charts one
per project - Quad charts
- Upper left Overview/problem
- Upper right Photo of the item in the initiative
- Lower left Solution
- Lower right Investment/ROI/cost avoidances
(realized/projected) use appropriate years for
the project
8
R-TOC Projects (3)
- Overview/Problem
Photo
Investment/ROI/Cost Avoidances (realized/projected
) M FY05 FY06 FY07 FY08
Total Investment Return
Cost Avoidance
FYDP (FY06-FY11) ROI (use
appropriate years for project)
- Solution
9
Section 4 Lessons Learned
- List and discuss lessons learned useful to all
programs for reducing cost, reducing OS costs,
increasing mission capable rates, new tools to
predict or improve OS costs, etc. (any subject) - As many charts as needed
10
Section 5 Forum Questions
- Respond to R-TOC Forum questions
- As many charts as needed
Recommended

