
Quantitative Arterial Spin Labelling ASL at UltraHigh Field 7.0 T PowerPoint PPT Presentation
1 / 1
Title: Quantitative Arterial Spin Labelling ASL at UltraHigh Field 7.0 T
1
Quantitative Arterial Spin Labelling (ASL) at
Ultra-High Field (7.0 T) A. G. Gardener, P. A.
Gowland and S. T. Francis Sir Peter Mansfield
Magnetic Resonance Centre, School of Physics and
Astronomy, University of Nottingham, University
Park, Nottingham, NG7 2RD, UK.
- Introduction and Theory
- At ultra-high field arterial spin labelling
(ASL) using magnetically-labelled blood as an
endogenous tracer - benefits from an overall
increase in SNR and T1 relaxation times of blood
and tissue. This leads to increased perfusion
weighted (PW) signals occurring at longer delay
times (TIs). - Here two Pulsed ASL schemes, STAR (Signal
Targeting with Alternating Radiofrequency) 1
and FAIR (Flow sensitive Alternating Inversion
Recovery) 2 are assessed in humans at 7.0 T. - STAR and FAIR PASL techniques are based on the
subtraction of two consecutively acquired label
and non-label images. STAR (Fig. 1A) uses a label
inversion slab (tag) applied proximal and a
non-label slab (control) applied distal to the
imaging slab. FAIR (Fig. 1B) uses a selective
inversion slab for the label, and a non-selective
inversion pulse for the non-labelled image,
centred over the imaging slab. In both cases the
difference between the label and non-label images
provides the PW signal. - However B1 and B0 inhomogeneity at 7.0 T can
lead to imperfect inversion pulse profiles,
resulting in offsets between label and non-label
images in the absence of perfusion. - One solution is to increase the gap between the
inversion slab and image slice, by altering the
width of the label/non-label, and/or by applying
pre-/post-saturation pulses to the imaging slices
immediately before/after the inversion pulses.
However, these can all have an adverse effect on
transit time. - These factors are assessed to determine the
optimal PASL sequence for use at 7.0 T.
Figure 1 (A) STAR and (B) FAIR ASL
Schemes.
- Method and Analysis
- Data were acquired on a 7.0 T Philips Achieva
scanner. For inversion a hyperbolic secant (hsc)
adiabatic pulse was used, whilst for
pre/post-saturation an optimized sinc-gauss pulse
was applied. Initial experiments performed on
phantoms assessed inversion pulse efficiency, a,
as a function of position for various slab
widths/offsets. Profiles of labelling slabs were
measured transaxially using sagittal SE-EPI
images. - For the ASL sequences, an image slab of five
GE-EPI slices with in-plane resolution of 3 x 3
mm2, 3 mm slice thickness with 1 mm slice gap, 64
x 64 matrix and echo time of 20 ms were acquired
in ascending order after each labelling scheme. - STAR used 70 mm wide label and non-label slabs
label gaps of 10-25 mm between image/inversion
slabs. FAIR used selective label slabs of 30 -
50 mm and 150 mm non-selective non-label slabs.
Widths of labels/non-labels were chosen to allow
for full refreshment of blood in the TR period.
The effect of the addition of pre-/post-saturation
pulses immediately before and after the
inversion pulse (up to 2 of each) and different
crusher gradient areas after each saturation
pulse was assessed. - The optimal STAR and FAIR labelling schemes were
performed on 4 healthy human volunteers, who gave
informed written consent. Images were acquired at
five TIs, with sixty ASL sets acquired at each
TI, with a TR of 3 s. Images were acquired both
with and without velocity crushing (diffusion
weighting 2.5 smm-1, critical velocity 20 mms-1).
A T1 map and M0 map were also generated for
perfusion quantification. PW images were formed
from (label - non-label) images and
quantification of perfusion performed using a
multi-compartment system model, assuming the T1
of arterial blood to be 2.0 s.
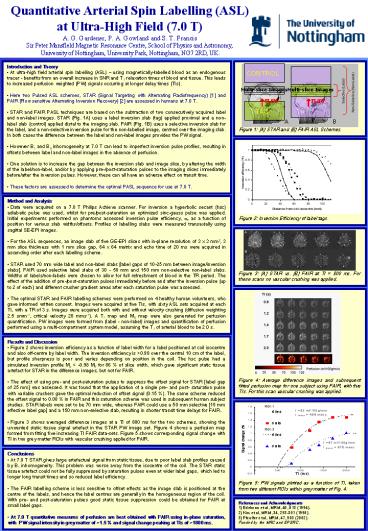
Figure 3 (A) STAR vs. (B) FAIR at TI
800 ms. For these scans no vascular crushing was
applied.
- Results and Discussion
- Figure 2 shows inversion efficiency as a
function of label width for a label positioned at
coil isocentre and also off-centre by label
width. The inversion efficiency is gt0.98 over the
central 10 cm of the label, but profile sharpness
is poor and varies depending on position in the
coil. The hsc pulse had a simulated inversion
profile Mz lt -0.98 M0 for 86 of slice width,
which gave significant static tissue artefact for
STAR in the difference images, but not for FAIR. - The effect of using pre- and post-saturation
pulses to suppress the offset signal for STAR
label gap of 25 mm was assessed. It was found
that the application of a single pre- and post-
saturation pulse with variable crushers gave the
optimal reduction of offset signal (0.15 ). The
same scheme reduced the offset signal to 0.08
in FAIR and this saturation scheme was used in
subsequent human subject studies. STAR labels
were set to be 70 mm wide, whereas FAIR could use
a 50 mm selective 15 mm effective label gap and
a 150 mm non-selective slab, resulting in shorter
transit time delays for FAIR. - Figure 3 shows averaged difference images at a
TI of 800 ms for the two schemes, showing the
unwanted static tissue signal artefact in the
STAR PW image set. Figure 4 shows a perfusion map
formed from fitting five increasing TI FAIR
data-sets. Figure 5 shows corresponding signal
change with TI in two grey matter ROIs with
vascular crushing applied for FAIR.
- Conclusions
- At 7.0 T STAR gives large artefactual signal
from static tissue, due to poor label slab
profiles caused by B1 inhomogeneity. This problem
was worse away from the isocentre of the coil.
The STAR static tissue artefact could not be
fully suppressed by saturation pulses even at
wider label gaps, which led to longer long
transit times and so reduced label efficiency. - The FAIR labelling scheme is less sensitive to
offset effects as the image slab is positioned at
the centre of the labels, and hence the label
centres are generally in the homogeneous region
of the coil. With pre- and post-saturation pulses
good static tissue suppression could be obtained
for FAIR at small label gaps. - At 7.0 T quantitative measures of perfusion are
best obtained with FAIR using in-plane
saturation, with PW signal intensity in grey
matter of 1.5 and signal change peaking at TIs
of 1800 ms.
References and Acknowledgments 1) Edelman et al,
MRM, 40, 513 (1994). 2) Kim et al, MRM, 34,
293-301 (1995). 3) Pfeuffer et al, MRM, 47, 903
(2002). Funded by the MRC and EPSRC.
Recommended
