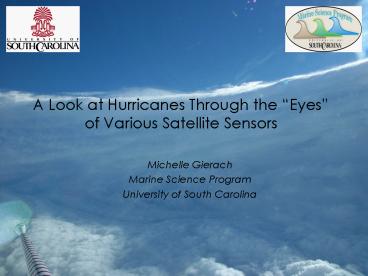
A Look at Hurricanes Through the Eyes of Various Satellite Sensors
1 / 20
Title: A Look at Hurricanes Through the Eyes of Various Satellite Sensors
1
A Look at Hurricanes Through the Eyes of
Various Satellite Sensors
- Michelle Gierach
- Marine Science Program
- University of South Carolina
2
(No Transcript)
3
Background
- During Hurricane Passage
- Strong wind stirring occurs at the surface of the
ocean - Mixed layer deepens
- Cold subsurface water and nutrients are injected
into the surface layer
http//www.nasa.gov/mpeg/115123main_ColdingEngine.
mpeg
- After Hurricane Passage
- Cold wakes are observed
- Phytoplankton blooms are detected
http//www.nasa.gov/mpeg/114586main_seabloom.mpeg
4
http//scienceblogs.com/intersection/upload/2006/0
9/ioke_sst_anom_2006.png
http//www.jhu.edu/scor/GEOHAB_2001.pdf
Walker et al., 2005
5
Data
- Sea Surface Temperature (SST)
- Advanced Very High Resolution Radiometer (AVHRR)
- Tropical Rainfall Measuring Mission Microwave
Imager (TMI) - Advanced Microwave Scanning Radiometer (AMSR-E)
http//www.noaanews.noaa.gov/stories2005/images/no
aa-n.jpg
- Sea Surface Height (SSH)
- Jason-1
- TOPEX/POSEIDON
- Geosat Follow-On (GFO)
- ERS-2
- Envisat
http//www.eorc.jaxa.jp/TRMM/about/outline/image/u
zutrmm.jpg
http//www2.jpl.nasa.gov/pub/images/browse/jason_b
rowse.jpg
- Chlorophyll-a Concentration
- MODerate resolution Imaging Spectroradiometer
(MODIS) - Sea-viewing Wide Field-of-view Sensor (SeaWiFS)
- Ocean Colour Monitor (OCM)
http//science.hq.nasa.gov/missions/images/aqua_or
bit.jpg
6
Case Studies
- Hurricanes Katrina and Rita (2005)
7
Gulf of Mexico
Gulf of Mexico SSTs (C) at 0000 UTC 15 August
2005 overlaid with SSH contours
8
Hurricane Katrina (2005)
From NHC http//www.nhc.noaa.gov/pdf/TCR-AL122005
_Katrina.pdf
- Hurricane Katrina made first landfall near the
border of Miami-Dade/Broward County at 2230 UTC
25 August as a category 1 hurricane - Katrina made second landfall as a category 3
hurricane near Buras, Louisiana at 1110 UTC 29
August - Katrina made final landfall at the
Louisiana-Mississippi border near the mouth of
the Pearl River as a category 3 hurricane
9
Hurricane Katrina (2005)AVHRR SST
1604 UTC 30 August 2005
0317 UTC 31 August 2005
- Pre-storm AVHRR SSTs exceeded 29C
- AVHRR SSTs cooled to approximately 26C 3-4 days
after hurricane passage - Maximum AVHRR SST change was 3-4C for Hurricane
Katrina
Gierach and Subrahmanyam, 2007
10
Hurricane Katrina (2005)TMI SST
25-28 August 2005
- Minimum TMI SSTs of 22-23C were observed on
25-28 August - Maximum TMI SST change was 6-7C for Hurricane
Katrina
Gierach and Subrahmanyam, 2008
11
Hurricane Katrina (2005)MODIS Chlorophyll-a
- Initial chlorophyll-a values ranged between 0-0.2
mg m-3 - Peak chlorophyll concentrations of 2.69 mg m-3
were observed 4 days after passage - Chlorophyll-a values returned to initial
concentrations 10-17 days after passage of Katrina
Gierach and Subrahmanyam, 2008
12
Hurricane Katrina (2005)SSHA
31 August 2005
- The interest region associated with Hurricane
Katrina occurred over a pre-existing cyclonic
circulation
Gierach and Subrahmanyam, 2008
13
Hurricane Rita (2005)
From NHC http//www.nhc.noaa.gov/pdf/TCR-AL182005
_Rita.pdf
- Hurricane Rita made landfall in southwestern
Louisiana at 0740 UTC 24 September as a category
3 hurricane
14
Hurricane Rita (2005)AVHRR and TMI SST
22-25 September 2005
0814 UTC 28 September 2005
- Hurricane Rita illustrated a similar SST response
to that of Katrina - AVHRR maximum sea surface cooling was 3-4C on 28
September - Minimum TMI SSTs of 24-25C, or an SST change of
4-5C, occurred on 22-25 September
Gierach and Subrahmanyam, 2007 2008
15
Hurricane Rita (2005)MODIS Chlorophyll-a
- Initial chlorophyll-a concentrations ranged
between 0-0.2 mg m-3 - Peak chlorophyll concentrations of 1.97 mg m-3
were observed 5 days after passage - Change in chlorophyll-a could have been greater,
but cloud coverage was an issue for the time
period associated with Rita
Gierach and Subrahmanyam, 2008
16
Hurricane Rita (2005)SSHA
28 September 2005
- The interest region associated with Hurricane
Rita transpired over a cyclonic circulation
Gierach and Subrahmanyam, 2008
17
Take Home Message
- Hurricanes are beneficial to Earth
- Redistribute heat
- Aside from devastation on land, hurricanes affect
the ocean in positive and negative ways - Expect to observe cold wakes and patchy
phytoplankton blooms after hurricane passage - Oceanic processes can greatly enhance
hurricane-induced responses
http//earthobservatory.nasa.gov/Library/Hurricane
s/
18
Thank You!
Hurricane Katrina (2005)
Hurricane Rita (2005)
http//rapidfire.sci.gsfc.nasa.gov/gallery/
This work is funded in part by the NASA physical
oceanography program and South Carolina Space
Grant Consortium
19
Satellite Oceanography Websites
- NOAA CoastWatch
- Provides near real-time SST, ocean surface wind,
and ocean color data from a variety of satellite
sensors for multiple ocean regions - http//coastwatch.noaa.gov
- http//cwcaribbean.aoml.noaa.gov/data.html
- Applied Physics Laboratory (APL) SST Imagery
- Provides near real-time AVHRR SSTs for a variety
of regions - http//fermi.jhuapl.edu/avhrr/index.html
- CCAR Near Real-Time Altimetry Data
- Supplies near real-time SSH and SSHA data for the
Gulf of Mexico and global ocean - http//argo.colorado.edu/realtime/welcome/
- POET
- Allows users to choose from multiple parameters
(temperature, wind, height, current) and
satellite sensors - http//poet.jpl.nasa.gov/
- Ocean Color Web
- Allows users to view various ocean color sensor
products
20
Satellite Oceanography Websites
- Giovanni
- Provides a simple and intuitive way to visualize,
analyze, and access vast amounts of Earth science
remote sensing data without having to download
the data - http//disc.sci.gsfc.nasa.gov/techlab/giovanni/
- (1) Ocean Color Radiometry Online Visualization
and Analysis - http//gdata1-ts1.sci.gsfc.nasa.gov/daac-bin/G3/gu
i.cgi?instance_idocean_model - http//gdata1-ts1.sci.gsfc.nasa.gov/daac-bin/G3/gu
i.cgi?instance_idocean_model_day - (2) Ocean Color Time-Series Online Visualization
and Analysis http//reason.gsfc.nasa.gov/Giovan
ni/ - (3) Hurricane Data Portal http//disc.sci.gsfc.n
asa.gov/hurricane/ - NOAA Harmful Algal Bloom (HAB) Forecasting
System - Supplies information on the location, extent, and
potential for development or movement of HABs in
the Gulf of Mexico - Users have access to near real-time and
historical observations and models from the
Harmful Algal BloomS Observing System (HABSOS) at
the National Coastal Data Development Center - http//www.csc.noaa.gov/crs/habf/

