EROSION PowerPoint PPT Presentation
1 / 35
Title: EROSION
1
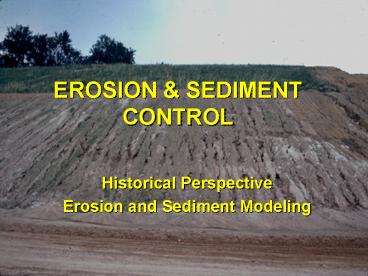
EROSION SEDIMENT CONTROL
- Historical Perspective
- Erosion and Sediment Modeling
2
GEOLOGIC EROSION vs ACCELERATED EROSION
3
EARLY WORK
4
What is SCS?
- Soil Erosion Service
- Soil Conservation Service
- Natural Resource Conservation Service
5
The Universal Soil Loss EquationARKLSCP
- Massive data base assembled (1950s 1970)
- Standard plots established throughout the US
- 72.6 ft long
- 13.3 ft wide
- 9 slope
- Fallow for two years
- Up and downhill tillage
(Wischmeier and Smith, 1965 and 1978)
6
The Coshocton Wheel Samplerand H-flume
7
PREDICTING EROSION USLE/RUSLE
A statistically-based model
- A R K LS C P
Some things we can control Some things we cannot
control
8
Rainfall Energy
R-factor
- We cannot control R factor
- Mobile, AL R 650
- Oklahoma R 80 300
- OKC R 200
9
Soil Erodibility K-factor
- We have little control of K factor
- Silt loam soil K .32
- Loamy fine sand K .17
- Affected by soil amendments
10
Length-Slope
LS-factor
- We have limited control on LS factor
- 9 slope, 72.6 ft LS 1.0
- 10 slope, 200 ft LS 2.41
- 15 slope, 200 ft LS 4.3
- 20 slope, 200 ft LS 11.31
Terraces, diversions, grade control
11
Cover Factor - C
0.5 tons/ac straw C0.3 2.0 tons/ac
straw C0.09 4.0 tons/ac woodchips C0.42
We can have a big impact on C-factor
12
Cover Factor
Geotextiles C ???
13
Cover Management
- Location of cover relative to receiving stream is
important
14
EXAMPLE 1
- Typical R 200
- Darnell K 0.32
- Slope Length 300 ft
- Slope 5
- Mature Forest C 0.001
- Practice Factor P 1
gt LS 1.0
A 0.064 tons/ac-yr
15
EXAMPLE 2
- Typical R 200
- Darnell K 0.32
- Slope Length 300 ft
- Slope 5
- Bare Soil (bulldozed) C 1
- Practice Factor P 1
gt LS 1.0
A 64 tons/ac-yr
16
Ratio of Sediment ProductionChanged Land
Use/Undisturbed Forest
17
EROSION vs. SEDIMENT YIELD
GULLY
CHANNEL
18
Event-based erosion estimationModified
USLE(MUSLE)
- Q Storm runoff
- qp Peak discharge
- KLSCP USLE parameters
WILLIAMS (1975)
19
Statistically Based Erosion Models
- Not process based
- Strong interactions between parameters,
particularly with steep slopes characteristic of
many urban sites - Requires a lot of data to project from one
situation to another without massive data base
20
RECENT WORK
- Extensive use of rainfall simulators and
instrumented plots - Process based models
- Incorporation into watershed models of hydrology
and sedimentology - Include the impact of BMPs and channel erosion
21
RAINFALL SIMULATORS
- Earliest version of rainfall simulator
- Simulation became a powerful tool in erosion
research
22
MODERN SIMULATORS
23
MODERN EROSION PLOTS
24
Characteristics of Recent Models 1990s
- Process based
- Divided into rill and inter-rill erosion
- Consider concentrated flow erosion separate from
rill and inter-rill - Deposition and detachment based on transport
capacity and detachment potential.
25
Rill Interrill Erosion
- Interrill erosion due to rainfall impact
- Rill erosion due to shearing forces of
runoff
26
RILL EROSION POTENTIALWEPP Model
- Drc Rill detachment potential
- Kr Rill erodibility
- Channel shear gRS
- tc Critical tractive force
- Fa Correction factor for soil
- type, cover, and freeze thaw
27
ACTUAL RILL EROSIONWEPP Model
- Drc Rill detachment potential
- Dr Actual detachment
- qs Sediment load
- Tc Transport capacity
28
(No Transcript)
29
TYPES OF EROSION Concentrated Flow or Ephemeral
Gully
- Location is due to macrorelief
- Shearing forces of runoff causes erosion
30
Concentrated Flow Erosion Foster-Lane Model
31
Concentrated Flow Erosion Foster-Lane
ModelAssumes Constant Flow Rate
Included in CREAMS and WEPP Models
32
Concentrated Flow Erosion KY DYRT Model
- Allows varying flow rates
- Allows layers of varying density
- Allows deposition
- Included in SEDIMOT III
33
DETACHMENT LIMITED AND TRANSPORT LIMITED FLOW
34
SEDIMENT SIZE DISTRIBUTION
- Eroded size distribution needed to predict
transport and BMP effectiveness - Methods available
- CREAMS based model
- Empirical study
35
OTHER WATERSHED MODELSWith Erosion Components
- CREAMS
- SEDIMOT II
- SEDCAD
- SEDIMOT III
- AGNPS
- SWAT

