
Chapter 13 An Introduction to UVVIS Molecular Absorption Spectroscopy PowerPoint PPT Presentation
1 / 26
Title: Chapter 13 An Introduction to UVVIS Molecular Absorption Spectroscopy
1
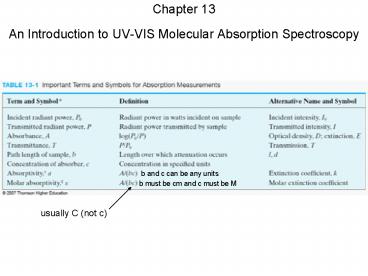
Chapter 13An Introduction to UV-VIS Molecular
Absorption Spectroscopy
b and c can be any units
b must be cm and c must be M
usually C (not c)
2
Beer's Law
- A ebC
- best way to determine molar absorptivity?
- Use slope of calibration curve (m eC)
constructed from several known concentrations
measured at desired wavelength - A ebC 0 (ideally)
- y mx b (real world)
- Do not use e A/bC except for rough estimate
3
benefits to using slope of best fit
line minimizes error by 1) factoring out
intercept if e A/bC used then each e
would be different because intercept
not factored out. Larger A gives
better e estimate 2) not using
individual points which may or not be on the
line if e (A-b)/bC used for
individual data points e will also
change unless R2 1.00000
4
Deviations from Beer's Law
- 1) Real - e is not constant with concentration
as concentration increases e decreases because
hsolution increases with concentration - emeasured (etrue)h/(h22)2
5
Deviations from Beer's Law
- 2) chemical - shifts in equilibria between
species which absorb at different wavelengths - Example
- 2 CrO42- 2 H 2 HCrO4-
Cr2O72- H2O - yellow orange
- How to measure different concentrations of
chromate? - How to measure different concentrations of
dichromate?
6
Deviations from Beer's Law
- 3) instrumental - Beer's Law assumes
monochromatic light which is never the case - example on board
7
Deviations from Beer's Law
- Instrumental deviations from Beer's Law most
severe if - 1) large bandpass and
- 2) narrow absorption peak
- if effective bandwidth (bandpass) of
spectrophotometer is lt 1/10 width of absorption
peak at half height then no significant
deviations from Beer's Law
8
Stray light effects
- Stray light scattered, reflected, pin hole
leaks, higher orders
9
(No Transcript)
10
Effects of instrumental noise (uncertainties) on
spectrophotometric analyses
11
k1 0.003
k2 0.003
k3 0.013
12
(No Transcript)
13
Sources
- black body
- W lamp VIS and near IR
- electric discharge lamps
- D2, H2 lamps primarily UV D2 more intense
than H2 - Hg, Xe UV and VIS
- Xe lamp is very intense
14
Types of Instruments
- 1) single beam
- 2) double beam in space
- 3) double beam in time
- 4) multichannel
15
(No Transcript)
16
Figure 13-19 (b) Spectronic 20
(photodiode)
detector on older Spectronic 20 models is a
phototube
17
(No Transcript)
18
Single source double beam spectrophotometer
19
Two source double beam spectrophotometer
transparent
front view of chopper wheel
nonreflective
mirror
20
transparent
mirror
transparent
From Skoog, Holler, and Crouch, Principles of
Instrumental Analysis, p. 359, 6th edition,
Thomson Brooks/Cole, Belmont, CA, 2007.
Figure 13-22
21
sample
sample
22
Single Beam vs. Double Beam
- Single Beam
- higher S/N (usually) fewer surfaces means more
hn transmitted - fewer photons lost measuring
dark current - less noise
- excels at single l measurement (single channel)
- cost (single channel)
- - corrects for slow fluctuations in signal
- Double Beam
- - lower S/N (usually) (more components means more
hn loss, only ¼ of hn goes through sample, noise) - - cost
- - more complex
- A vs. l (spectra)
- corrects for all but fastest fluctuations in
signal
23
(No Transcript)
24
Agilent Technologies Model 8453 diode-array
spectrophotometer
Figure 13-25
From Skoog, Holler, and Crouch, Principles of
Instrumental Analysis, p. 362, 6th edition,
Thomson Brooks/Cole, Belmont, CA, 2007.
25
Benefits of single beam multichannel instrument
- Has all benefits of a double beam instrument
except
26
From Skoog, Holler, and Crouch, Principlesof
Instrumental Analysis, p. 360, 6th edition,
Thomson Brooks/Cole, Belmont, CA, 2007.
Figure 13-23
Recommended
