
XP1 Blending Chart PowerPoint PPT Presentation
1 / 8
Title: XP1 Blending Chart
1
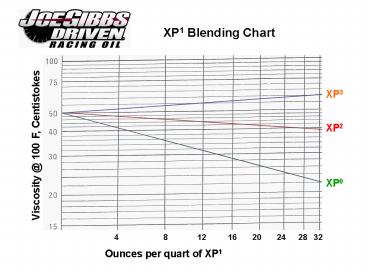
XP1 Blending Chart
XP3
XP2
Viscosity _at_ 100F, Centistokes
XP0
32
28
24
20
16
12
8
4
Ounces per quart of XP1
2
XP1 Blending Chart
XP3
XP2
Viscosity _at_ 212F, Centistokes
XP0
4
8
12
16
20
24
28
32
Ounces per quart of XP1
3
XP2 Blending Chart
XP3
XP1
Viscosity _at_ 100F, Centistokes
XP0
32
28
24
20
16
12
8
4
Ounces per quart of XP2
4
XP2 Blending Chart
XP3
XP1
Viscosity _at_ 212F, Centistokes
XP0
4
8
12
16
20
24
28
32
Ounces per quart of XP2
5
XP3 Blending Chart
XP1
Viscosity _at_ 100F, Centistokes
XP2
XP0
32
28
24
20
16
12
8
4
Ounces per quart of XP3
6
XP3 Blending Chart
XP1
XP2
Viscosity _at_ 212F, Centistokes
XP0
4
8
12
16
20
24
28
32
Ounces per quart of XP3
7
XP0 Blending Chart
XP3
XP1
XP2
Viscosity _at_ 100F, Centistokes
32
28
24
20
16
12
8
4
Ounces per quart of XP0
8
XP0 Blending Chart
XP3
XP1
XP2
Viscosity _at_ 212F, Centistokes
4
8
12
16
20
24
28
32
Ounces per quart of XP0
Recommended
