
Deanna Hence, Stacy Brodzik and Robert Houze University of Washington
Title: Deanna Hence, Stacy Brodzik and Robert Houze University of Washington
1
Vertical Structure of TCSP and RAINEX Hurricanes
as seen by the TRMM PR
Deanna Hence, Stacy Brodzik and Robert
HouzeUniversity of Washington
CFAD analysis illustrates the differences in
precipitation structure as a function of radius
for four major Gulf hurricanes. The
precipitation in the innermost ring was mostly
uniform and intense, with evidence of occasional
deep convective towers. The precipitation was
more shallow and stratiform in the middle radii
and deeper and more convective at the farthest
radii. Further CFAD analysis shows little
variation in structure from quadrant to quadrant.
This symmetry is consistent with the low shear
environments of all four storms. The CFAD
analysis provides a statistical dataset of storm
precipitation structure for comparing with
high-resolution numerical models For future
work, some planned groupings for CFAD generation
to expand study to all tropical cyclone basins
for all years of TRMM mission (1998-present)
include ? Storm strength (categories 1-5 on
the Saffir-Simpson Scale)
? Basin (N. Atlantic, NW
Pacific, etc.)
? Latitude (I.e. 10º-15º, 15º-20º, etc.)
?
Analyze sheared storms by quadrants
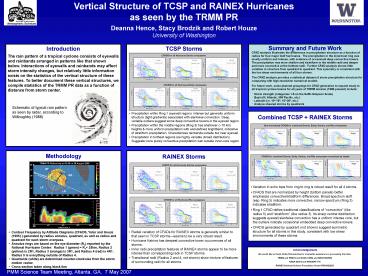
The rain pattern of a tropical cyclone consists
of eyewalls and rainbands arranged in patterns
like that shown below. Interactions of eyewalls
and rainbands may affect storm intensity changes,
but relatively little information exists on the
statistics of the vertical structure of these
features. To better document these vertical
structures, we compile statistics of the TRMM PR
data as a function of distance from storm center.
- Precipitation within Ring 1 (eyewall region).
Intense but generally uniform structure (tight
gradients) associated with slantwise convection.
Deep, variable outliers suggest some deep
convective towers in the eyewall region. - Precipitation within the middle regions (Ring 3)
has shallower (10 km) heights more uniform
precipitation with well-defined brightband,
indicative of stratiform precipitation.
Characterizes rainbands outside but near eyewall. - Precipitation in furthest regions are highly
variable (broad distribution). Suggests more
purely convective precipitation well outside
inner-core region.
- Variation in echo tops from ring to ring is
robust result for all 4 storms. - CFADS that are normalized by height (bottom
panels) better emphasize convective/stratiform
differences. Broad spectrum aloft (esp. Ring 5)
indicates more convective narrow spectrum (Ring
3) indicates stratiform. - Ring 1 CFAD defies traditional classifications of
convective (like radius 5) and stratiform
(like radius 3). Its sharp central distribution
suggests eyewall slantwise convection has a
uniform intense core, but the outliers indicate
occasional embedded deep convective towers. - CFADS generated by quadrant (not shown) suggest
symmetric structure for all storms in this study,
consistent with low shear environments of these
storms.
- Radial variation of CFADs for RAINEX storms is
generally similar to that seen in TCSP
stormsseems to be a very robust result. - Hurricane Katrina has deepest convective tower
occurrences of all storms. - Inner radii precipitation features of RAINEX
storms appear to be more intense than
corresponding radii in TCSP storms. - Transitional radii (Radius 2 and 4, not shown)
show mixture of features of surrounding radii for
all storms.
- Contour Frequency by Altitude Diagrams (CFADS,
Yuter and Houze (1995) ) generated by radius
annulus, quadrant, as well as radius and quadrant
for each storm overpass. - Annulus rings are based on the eye diameter (Re)
reported by the National Hurricane Center
Radius 1 (green) Re 25km, Radius 2 (yellow) is
2R1, Radius 3 (orange) is 3R1, and Radius 4 (red)
is 4R1. Radius 5 is everything outside of Radius
4. - Quadrants (white) are determined
counter-clockwise from the storm motion vector. - Cross-section taken along black line
PMM Science Team Meeting, Atlanta, GA, 7 May 2007
Recommended
