
Exploring InfoVis Publication History with Tulip PowerPoint PPT Presentation
1 / 1
Title: Exploring InfoVis Publication History with Tulip
1
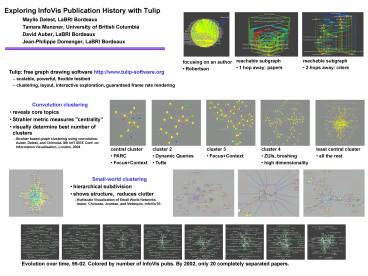
Exploring InfoVis Publication History with Tulip
- Maylis Delest, LaBRI Bordeaux
- Tamara Munzner, University of British Columbia
- David Auber, LaBRI Bordeaux
- Jean-Philippe Domenger, LaBRI Bordeaux
- reachable subgraph
- 2 hops away citers
- reachable subgraph
- 1 hop away papers
- focusing on an author
- Robertson
- Tulip free graph drawing software
http//www.tulip-software.org - scalable, powerful, flexible testbed
- clustering, layout, interactive exploration,
guaranteed frame rate rendering
- Convolution clustering
- reveals core topics
- Strahler metric measures "centrality"
- visually determine best number of clusters
- Strahler based graph clustering using
convolution.Auber, Delest, and Chiricota. 8th
Int'l IEEE Conf. on Information Visualisation,
London, 2004
- central cluster
- PARC
- FocusContext
- cluster 2
- Dynamic Queries
- Tufte
- cluster 3
- FocusContext
- cluster 4
- ZUIs, brushing
- high dimensionality
- least central cluster
- all the rest
- Small-world clustering
- hierarchical subdivision
- shows structure, reduces clutter
- Multiscale Visualization of Small World
Networks.Auber, Chiricota, Jourdan, and
Melançon. InfoVis'03
Evolution over time, 95-02. Colored by number of
InfoVis pubs. By 2002, only 20 completely
separated papers.
Recommended
