
Comparison of automatic time curve selection methods for breast MR CAD PowerPoint PPT Presentation
1 / 1
Title: Comparison of automatic time curve selection methods for breast MR CAD
1
Comparison of automatic time curve selection
methods for breast MR CAD
Tanya Niemeyera, Chris Wooda, Keith Stegbauera,
Justin Smithab aConfirma, Inc., 821 Kirkland Ave
Ste 100, Kirkland, WA, USA 98033 bFirst Hill
Diagnostic Imaging, 1001 Boylston Ave, Seattle,
WA, USA 98104
INTRODUCTION Dynamic contrast breast MR is being
used for detection, diagnoses, and staging of
breast cancer, especially for women at high
risk1. Breast MR acquisitions consist of a
pre-contrast baseline scan followed by several
post-contrast series at multiple time points
(Figure 1). Typically, CAD algorithms have
focused on the morphological information provided
in a single scan, but CAD for breast MR can use
an entirely new class of temporal features. This
study examines a single temporal feature, a time
versus percent enhancement curve. The automatic
extraction of this feature could lead to better
CAD algorithms for breast cancer detection in MR.
RESULTS All 42 VOIs represented malignant areas.
The time curves found using highest percent
enhancement showed washout in 52 percent (22/42)
of lesions. Using a hierarchical search, 90
percent (38/42) of lesions showed washout type
curves (Figure 6). The average curve for all
lesions showed a plateau shape when only
enhancement was used for selection. With the
hierarchical selection used, the average curve
demonstrated washout behavior. Using washout
behavior as indicative of malignancy, the
hierarchical search is 38 percent more sensitive.
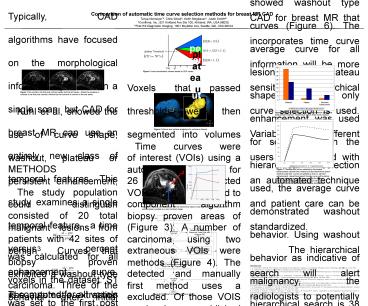
Voxels that passed thresholds were then segmented
into volumes of interest (VOIs) using a 26
neighbor connected component algorithm (Figure
3). A number of extraneous VOIs were detected and
manually excluded. Of those VOIS that were not
true lesions, all were determined to be vessels
or cardiac artifact due to enhancement and motion
of the heart.
Figure 1 Pre contrast, the first post contrast
series and the last series. Notice the increase
in contrast in the first post contrast, followed
by the washout of contrast in the last series.
Kuhl et al, showed the use of curve shape,
washout, plateau or persistent enhancement,
could distinguish malignant lesions from benign3.
Curves that exhibited a washout type behavior
after initial enhancement had an 87 percent
probability of being malignant, whereas curves
that exhibited persistent enhancement only showed
a 6 percent likelihood of being malignant.
Washout behavior of lesions has also been shown
to be correlated with tumor angiogenesis and
vascular permeability4,5. Manual selection of
curves requires the radiologist or MR technician
to place a small region of interest over an area
of enhancement. Several publications have found
substantial observer variability in manual
methods6,7. Automation of this task can be easily
preformed by a computer to and offers a way to
standardize temporal breast MR interpretation.
This study compares an enhancement only
technique for curve generation to a hierarchical
search algorithm that incorporates end time point
behavior. The curves from both methods are
examined.
Figure 6 Types of curves found with hierarchical
search and largest enhancement method.
Hierarchical search finds more washout curves.
Figure 3 Volume and surface rendering of a volume
of interest.
Time curves were automatically selected for VOIs
that corresponded to biopsy proven areas of
carcinoma using two methods (Figure 4). The first
method uses a previously published technique in
which the most enhancing 3x3 voxel set in the
volume of interest is selected7. The second
technique we have developed employs a
hierarchical search strategy to find the most
important time curve for a 3x3 voxel set (Figure
5). With the hierarchical search the curve
location with the highest initial enhancement was
still selected, but washout type curves were
selected before plateau and persistent
enhancement curve types.
METHODS The study population consisted of 20
total patients with 42 sites of biopsy proven
carcinoma. Three of the sites were lobular
carcinoma the remaining lesions were
infiltrating ductal carcinomas. All patients were
scanned on a 1.0 T magnet using a bilateral
breast protocol. The acquisition consisted of a
dynamic T1-weighted, fat suppressed, 3D gradient
echo sequence. Following a pre contrast scan, up
to 20 ml of Gadolinium (0.1 mmol/kg) was injected
at 2 ml/s followed by a saline flush of 30 ml at
2 ml/s. Five post contrast series were acquired
following the contrast injection spaced one min
apart. Before selection of a time curve, all
series were aligned using a 2D non-rigid
registration algorithm8. The reference dataset
was always set to the peak contrast series to
minimize changes to areas of contrast
enhancement. Registration used a multi-resolution
pyramid strategy, starting at a sub-sampled level
and progressing to higher resolutions. Rigid and
affine alignments were performed before the
algorithm corrected for local deformation. The
sum of squared differences was minimized for each
pyramid level using a gradient descent based
optimization. Segmentation of suspicious areas
was based on the enhancement properties of the
tissue. The percent enhancement,
Figure 7 Characteristic curves selected by the
largest enhancement (dashed line) method and the
hierarchical search method (solid line). Curves
are plotted as time vs. percent enhancement.
Hierarchical search found a curve with washout
behavior indicating a malignant lesion while the
largest enhancement method only detected a curve
with continued enhancement falsely indicating a
benign lesion.
CONCLUSIONS Selecting a characteristic time
curve based solely on initial enhancement could
lead to false negatives if only curve shape is
used to determine whether a lesion is benign or
malignant (Figure 7). Often persistent
enhancement type curves were detected when using
only initial enhancement as a criteria, which are
94 percent likely to represent benign lesions3.
The hierarchical search strategy, which located
areas first demonstrating washout behavior,
resulted in curves most indicative of malignancy
in all cases. CAD for breast MR that incorporates
time curve information will be more sensitive if
hierarchical curve selection is used. Variability
of different users is eliminated with an
automated technique and patient care can be
standardized. The hierarchical search will
alert radiologists to potentially malignant
lesions based on the temporal information more
often than the enhancement only technique leading
higher sensitivity. However, this study only
incorporates malignant lesions, so while the
hierarchical search ends results in a higher
sensitivity than the enhancement only method, we
cannot determine if the specificity is affected
without incorporation of additional cases with
benign lesions. We find it interesting that with
the percent enhancement detection method, curves
that have much higher initial enhancement are
found compared to the hierarchical search.
Washout behavior might actually begin to happen
before the contrast uptake can reach a maximum
level.
Figure 4 Example curves obtained with the
hierarchical search (red) and the largest
enhancement method (blue) overlaid on a post
contrast image.
was calculated for all voxels in the dataset. S1
was set to the first post contrast series. Those
voxels passing an uptake threshold of PE 50
percent were included for further analysis.
Voxels must also pass a difference threshold,
which eliminates pixels with low signal
intensities from qualifying as a suspicious area.
The difference threshold was set to three
standard deviations of the subtraction volume,
s1-s0. The signal enhancement ratio,
REFERENCES 1. S. Orel and M. Schnall, MR Imaging
of the Breast for the Detection, Diagnosis, and
Staging of Breast Cancer, Radiology, vol. 220,
pp.13-30, 2001. 2. R. Warren and A. Coulthard,
Breast MRI in Practice, pp.43-69, Martin Dunitz,
London, 2002. 3. C. Kuhl, Dynamic Breast MR
Imaging Are Signal Intensity Time Course Data
Useful for Differential Diagnosis of Enhancing
Lesions? Radiology, vol. 211, pp.101-110,
1999. 4. M. Knopp, E. Weiss, H. Sinn, J. Mattern,
H. Junkermann, J. Radeleff, A. Magner, G. Brix,
S. Delorme, I. Zuna, G. van Kaick,
Pathophysiologic Basis of Contrast Enhancement
in Breast Tumors, Journal of Magnetic Resonance
Imaging, vol. 10, pp. 260-266, 1999. 5. L.
Esserman, N. Hylton, T. George, N Weidner,
Contrast-Enhanced Magnetic Resonance Imaging to
Assess Tumor Histopathology and Angiogenesis in
Breast Carcinoma, The Breast Journal, vol. 5 no.
1, pp. 13-22, 1999. 6. G. Liney, P. Gibbs, C.
Hayes, M. Leach, L. Turnbull, Dynamic
Contrast-Enhanced MRI in the Differentiation of
Breast Tumors User-Defined Versus Semi-automated
Region-of-Interest Analysis, Journal of Magnetic
Resonance Imaging, vol. 10, pp.945-949, 1999. 7.
S. Mussurakis, D. Buckley, A. Horsman, Dynamic
MRI of Invasive Breast Cancer Assessment of
Three Regionof-Interest Analysis Methods,
Journal of Computer Assisted Tomography, vol. 21
no. 3, pp. 431-438, 1997. 8. R. Kumar, J. Asmuth,
K. Hanna, J. Bergen, C. Hulka, D. Kopans, R.
Weisskoff, R. Moore, Application of 3D
Registration for Detecting Lesions in Magnetic
Resonance Breast Scans, Proceedings of the SPIE,
1996. 9. N. Hylton, Vascularity Assessment of
Breast Lesions with Gadolinium-enhanced MR
Imaging, Magnetic Resonance Imaging Clinics of
North America, vol. 9 no. 2, pp. 321-332, 2001.
is computed for all voxels that pass both the
uptake and the difference threshold. The fourth
post contrast series was selected s2. The SER to
effectively measures the temporal characteristics
at the end of the dynamic series voxels can be
classified into washout, plateau, or persistent
enhancement curve types (Figure 2)9.
Recommended
