
Ch 9: Risk and Rates of Return PowerPoint PPT Presentation
1 / 128
Title: Ch 9: Risk and Rates of Return
1
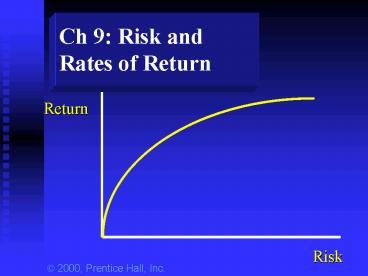
Ch 9 Risk and Rates of Return
? 2000, Prentice Hall, Inc.
2
In Chapter 9we examine RISK
- How to measure risk
- (variance, standard deviation, beta)
- How to reduce risk
- (diversification)
- How to price risk
- (security market line, CAPM)
3
For a Treasury security, what is the required
rate of return?
4
For a Treasury security, what is the required
rate of return?
5
For a Treasury security, what is the required
rate of return?
- Since Treasuries are essentially free of default
risk, the rate of return on a Treasury security
is considered the risk-free rate of return.
6
For a corporate stock or bond, what is the
required rate of return?
7
For a corporate stock or bond, what is the
required rate of return?
8
For a corporate stock or bond, what is the
required rate of return?
9
For a corporate stock or bond, what is the
required rate of return?
- How large of a risk premium should we require to
buy a corporate security?
10
Returns
- Expected Return - the return that an investor
expects to earn on an asset, given its price,
growth potential, etc. - Required Return - the return that an investor
requires on an asset given its risk and market
interest rates.
11
Expected Return
- State of Probability Return
- Economy (P) Orl. Utility
Orl. Tech - Recession .20 4
-10 - Normal .50 10
14 - Boom .30 14
30 - For each firm, the expected return on the stock
is just a weighted average
12
Expected Return
- State of Probability Return
- Economy (P) Orl. Utility
Orl. Tech - Recession .20 4
-10 - Normal .50 10
14 - Boom .30 14
30 - For each firm, the expected return on the stock
is just a weighted average - k P(k1)k1 P(k2)k2 ... P(kn)kn
13
Expected Return
- State of Probability Return
- Economy (P) Orl. Utility
Orl. Tech - Recession .20 4
-10 - Normal .50 10
14 - Boom .30 14
30 - k P(k1)k1 P(k2)k2 ... P(kn)kn
- k (OU) .2 (4) .5 (10) .3 (14) 10
14
Expected Return
- State of Probability Return
- Economy (P) Orl. Utility
Orl. Tech - Recession .20 4
-10 - Normal .50 10
14 - Boom .30 14
30 - k P(k1)k1 P(k2)k2 ... P(kn)kn
- k (OI) .2 (-10) .5 (14) .3 (30) 14
15
- Based only on your expected return calculations,
which stock would you prefer?
16
Have you considered
RISK?
17
What is Risk?
- The possibility that an actual return will differ
from our expected return. - Uncertainty in the distribution of possible
outcomes.
18
What is Risk?
- Uncertainty in the distribution of possible
outcomes.
19
What is Risk?
- Uncertainty in the distribution of possible
outcomes.
20
What is Risk?
- Uncertainty in the distribution of possible
outcomes.
21
How do we Measure Risk?
- To get a general idea of a stocks price
variability, we could look at the stocks price
range over the past year.
52 weeks Yld Vol
Net Hi Lo Sym Div PE 100s Hi
Lo Close Chg 139 81 IBM .48 .5 26
56598 108 106 1065/8 -2 119 75 MSFT
60 254888 96 93 953/8 1/4
22
How do we Measure Risk?
- A more scientific approach is to examine the
stocks standard deviation of returns. - Standard deviation is a measure of the dispersion
of possible outcomes. - The greater the standard deviation, the greater
the uncertainty, and therefore , the greater the
risk.
23
Standard Deviation
- (ki - k)2 P(ki)
24
- Orlando Utility, Inc.
25
- Orlando Utility, Inc.
- ( 4 - 10)2 (.2) 7.2
26
- Orlando Utility, Inc.
- ( 4 - 10)2 (.2) 7.2
- (10 - 10)2 (.5) 0
27
- Orlando Utility, Inc.
- ( 4 - 10)2 (.2) 7.2
- (10 - 10)2 (.5) 0
- (14 - 10)2 (.3) 4.8
28
- Orlando Utility, Inc.
- ( 4 - 10)2 (.2) 7.2
- (10 - 10)2 (.5) 0
- (14 - 10)2 (.3) 4.8
- Variance 12
29
- Orlando Utility, Inc.
- ( 4 - 10)2 (.2) 7.2
- (10 - 10)2 (.5) 0
- (14 - 10)2 (.3) 4.8
- Variance 12
- Stand. dev. 12
30
- Orlando Utility, Inc.
- ( 4 - 10)2 (.2) 7.2
- (10 - 10)2 (.5) 0
- (14 - 10)2 (.3) 4.8
- Variance 12
- Stand. dev. 12 3.46
31
- Orlando Technology, Inc.
32
- Orlando Technology, Inc.
- (-10 - 14)2 (.2) 115.2
33
- Orlando Technology, Inc.
- (-10 - 14)2 (.2) 115.2
- (14 - 14)2 (.5) 0
34
- Orlando Technology, Inc.
- (-10 - 14)2 (.2) 115.2
- (14 - 14)2 (.5) 0
- (30 - 14)2 (.3) 76.8
35
- Orlando Technology, Inc.
- (-10 - 14)2 (.2) 115.2
- (14 - 14)2 (.5) 0
- (30 - 14)2 (.3) 76.8
- Variance 192
36
- Orlando Technology, Inc.
- (-10 - 14)2 (.2) 115.2
- (14 - 14)2 (.5) 0
- (30 - 14)2 (.3) 76.8
- Variance 192
- Stand. dev. 192
37
- Orlando Technology, Inc.
- (-10 - 14)2 (.2) 115.2
- (14 - 14)2 (.5) 0
- (30 - 14)2 (.3) 76.8
- Variance 192
- Stand. dev. 192 13.86
38
- Which stock would you prefer?
- How would you decide?
39
- Which stock would you prefer?
- How would you decide?
40
Summary
- Orlando
Orlando - Utility Technology
- Expected Return 10 14
- Standard Deviation 3.46 13.86
41
- It depends on your tolerance for risk!
- Remember, theres a tradeoff between risk and
return.
42
- It depends on your tolerance for risk!
- Remember, theres a tradeoff between risk and
return.
43
- It depends on your tolerance for risk!
- Remember, theres a tradeoff between risk and
return.
44
Portfolios
- Combining several securities in a portfolio can
actually reduce overall risk. - How does this work?
45
Suppose we have stock A and stock B. The returns
on these stocks do not tend to move together over
time (they are not perfectly correlated).
46
Suppose we have stock A and stock B. The returns
on these stocks do not tend to move together over
time (they are not perfectly correlated).
47
Suppose we have stock A and stock B. The returns
on these stocks do not tend to move together over
time (they are not perfectly correlated).
48
What has happened to the variability of returns
for the portfolio?
49
What has happened to the variability of returns
for the portfolio?
50
Diversification
- Investing in more than one security to reduce
risk. - If two stocks are perfectly positively
correlated, diversification has no effect on
risk. - If two stocks are perfectly negatively
correlated, the portfolio is perfectly
diversified.
51
- If you owned a share of every stock traded on the
NYSE and NASDAQ, would you be diversified? - YES!
- Would you have eliminated all of your risk?
- NO! Common stock portfolios still have risk.
52
Some risk can be diversified away and some can
not.
- Market risk (systematic risk) is
nondiversifiable. This type of risk can not be
diversified away. - Company-unique risk (unsystematic risk) is
diversifiable. This type of risk can be reduced
through diversification.
53
Market Risk
- Unexpected changes in interest rates.
- Unexpected changes in cash flows due to tax rate
changes, foreign competition, and the overall
business cycle.
54
Company-unique Risk
- A companys labor force goes on strike.
- A companys top management dies in a plane crash.
- A huge oil tank bursts and floods a companys
production area.
55
- As you add stocks to your portfolio,
company-unique risk is reduced.
56
- As you add stocks to your portfolio,
company-unique risk is reduced.
57
- As you add stocks to your portfolio,
company-unique risk is reduced.
58
- As you add stocks to your portfolio,
company-unique risk is reduced.
59
Do some firms have more market risk than others?
- Yes. For example
- Interest rate changes affect all firms, but which
would be more affected - a) Retail food chain
- b) Commercial bank
60
Do some firms have more market risk than others?
- Yes. For example
- Interest rate changes affect all firms, but which
would be more affected - a) Retail food chain
- b) Commercial bank
61
- Note
- As we know, the market compensates investors for
accepting risk - but only for market risk.
Company-unique risk can and should be diversified
away. - So - we need to be able to measure market risk.
62
This is why we have Beta.
- Beta a measure of market risk.
- Specifically, beta is a measure of how an
individual stocks returns vary with market
returns. - Its a measure of the sensitivity of an
individual stocks returns to changes in the
market.
63
The markets beta is 1
- A firm that has a beta 1 has average market
risk. The stock is no more or less volatile than
the market. - A firm with a beta gt 1 is more volatile than the
market.
64
The markets beta is 1
- A firm that has a beta 1 has average market
risk. The stock is no more or less volatile than
the market. - A firm with a beta gt 1 is more volatile than the
market. - (ex technology firms)
65
The markets beta is 1
- A firm that has a beta 1 has average market
risk. The stock is no more or less volatile than
the market. - A firm with a beta gt 1 is more volatile than the
market. - (ex technology firms)
- A firm with a beta lt 1 is less volatile than the
market.
66
The markets beta is 1
- A firm that has a beta 1 has average market
risk. The stock is no more or less volatile than
the market. - A firm with a beta gt 1 is more volatile than the
market. - (ex technology firms)
- A firm with a beta lt 1 is less volatile than the
market. - (ex utilities)
67
Calculating Beta
68
Calculating Beta
XYZ Co. returns
SP 500 returns
69
Calculating Beta
70
Calculating Beta
71
Calculating Beta
72
Summary
- We know how to measure risk, using standard
deviation for overall risk and beta for market
risk. - We know how to reduce overall risk to only market
risk through diversification. - We need to know how to price risk so we will know
how much extra return we should require for
accepting extra risk.
73
What is the Required Rate of Return?
- The return on an investment required by an
investor given market interest rates and the
investments risk.
74
(No Transcript)
75
(No Transcript)
76
(No Transcript)
77
(No Transcript)
78
(No Transcript)
79
(No Transcript)
80
- Required
- rate of
- return
Lets try to graph this relationship!
Beta
81
- Required
- rate of
- return
.
12
Risk-free rate of return (6)
Beta
1
82
- Required
- rate of
- return
security market line (SML)
.
12
Risk-free rate of return (6)
Beta
1
83
- This linear relationship between risk and
required return is known as the Capital Asset
Pricing Model (CAPM).
84
- Required
- rate of
- return
SML
.
12
Risk-free rate of return (6)
0
Beta
1
85
- Required
- rate of
- return
SML
Is there a riskless (zero beta) security?
.
12
Risk-free rate of return (6)
0
Beta
1
86
- Required
- rate of
- return
SML
Is there a riskless (zero beta) security?
.
12
Treasury securities are as close to riskless as
possible.
Risk-free rate of return (6)
0
Beta
1
87
- Required
- rate of
- return
SML
Where does the SP 500 fall on the SML?
.
12
Risk-free rate of return (6)
0
Beta
1
88
- Required
- rate of
- return
SML
Where does the SP 500 fall on the SML?
.
12
The SP 500 is a good approximation for the
market
Risk-free rate of return (6)
0
Beta
1
89
- Required
- rate of
- return
SML
Utility Stocks
.
12
Risk-free rate of return (6)
0
Beta
1
90
- Required
- rate of
- return
SML
High-tech stocks
.
12
Risk-free rate of return (6)
0
Beta
1
91
The CAPM equation
92
The CAPM equation
b
- kj krf j (km - krf )
93
The CAPM equation
b
- kj krf j (km - krf )
- where
- kj the required return on security j,
- krf the risk-free rate of interest,
- j the beta of security j, and
- km the return on the market index.
b
94
Example
- Suppose the Treasury bond rate is 6, the average
return on the SP 500 index is 12, and Walt
Disney has a beta of 1.2. - According to the CAPM, what should be the
required rate of return on Disney stock?
95
kj krf (km - krf )
b
- kj .06 1.2 (.12 - .06)
- kj .132 13.2
- According to the CAPM, Disney stock should be
priced to give a 13.2 return.
96
- Required
- rate of
- return
SML
.
12
Risk-free rate of return (6)
0
Beta
1
97
- Required
- rate of
- return
SML
Theoretically, every security should lie on the
SML
.
12
Risk-free rate of return (6)
0
Beta
1
98
- Required
- rate of
- return
SML
Theoretically, every security should lie on the
SML
.
12
If every stock is on the SML, investors are
being fully compensated for risk.
Risk-free rate of return (6)
0
Beta
1
99
- Required
- rate of
- return
SML
If a security is above the SML, it is underpriced.
.
12
Risk-free rate of return (6)
0
Beta
1
100
- Required
- rate of
- return
SML
If a security is above the SML, it is underpriced.
.
12
If a security is below the SML, it is
overpriced.
Risk-free rate of return (6)
0
Beta
1
101
Practice Problem
- Find the intrinsic value of a common stock with
the following information - ROE 20
- 50 retention of earnings
- Beta 1.4
- recent dividend 4.30
- Treasury bond yield 7.5
- Return on the SP 500 12
- Market price for common stock 100
- Should you buy the stock?
102
Practice Problem
- g ROE x r .20 x .50 10
- D0 4.30, so D1 4.30 (1.10) 4.73
- k .075 1.4 (.12 - .075) .138
103
Practice Problem
- g ROE x r .20 x .50 10
- D0 4.30, so D1 4.30 (1.10) 4.73
- k .075 1.4 (.12 - .075) .138
104
Practice Problem
- g ROE x r .20 x .50 10
- D0 4.30, so D1 4.30 (1.10) 4.73
- k .075 1.4 (.12 - .075) .138
105
Practice Problem
- g ROE x r .20 x .50 10
- D0 4.30, so D1 4.30 (1.10) 4.73
- k .075 1.4 (.12 - .075) .138
106
Practice Problem
- g ROE x r .20 x .50 10
- D0 4.30, so D1 4.30 (1.10) 4.73
- k .075 1.4 (.12 - .075) .138
107
Practice Problem
- Using the following monthly stock prices,
calculate the stocks standard deviation of
returns.
108
Simple Return Calculations
109
Simple Return Calculations
110
Simple Return Calculations
111
Simple Return Calculations
112
(No Transcript)
113
(No Transcript)
114
(No Transcript)
115
(No Transcript)
116
(No Transcript)
117
(No Transcript)
118
(No Transcript)
119
(No Transcript)
120
(No Transcript)
121
(No Transcript)
122
(No Transcript)
123
(No Transcript)
124
(No Transcript)
125
(No Transcript)
126
(No Transcript)
127
(No Transcript)
128
Calculator solution using HP 10B
- Enter monthly return on 10B calculator, followed
by sigma key (top right corner). - Shift 7 gives you the expected return.
- Shift 8 gives you the standard deviation.
Recommended
