
Oklahoma State Regents for Higher Education FY10 Budget Request PowerPoint PPT Presentation
1 / 25
Title: Oklahoma State Regents for Higher Education FY10 Budget Request
1
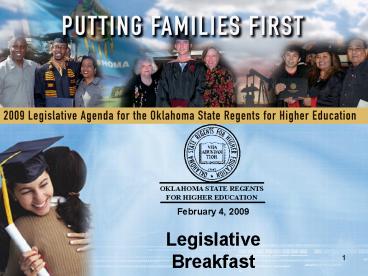
OKLAHOMA STATE REGENTS FOR HIGHER EDUCATION
February 4, 2009 Legislative Breakfast
2
THANK YOU
3
Public Agenda Goals
Increase access and improve the quality of public
higher education for all Oklahomans
Increase the number of college graduates
Better prepare students to meet the challenge of
a global economy
4
Spellings Commission
Source Spellings Commission Report on Higher
Education, November 2006
- Access
- Affordability
- Accountability
Secretary Margaret Spellings
5
Performance Indicators
- Enrollment
- Degrees Conferred
- Employment Outcomes
- Economic Impact
6
Enrollment
Oklahoma is now ranked in the Top 10 nationally
in thepercentage of students enrolled in public
higher education.
Source 2008 Student Data Report
Enrollment in Oklahoma Public Colleges and
Universities Six Year Trend
250,000
240,000
238,245
235,730
234,873
228,249
230000
220,768
220,000
213,972
210,000
200,000
2000- 01
2001- 02
2002- 03
2003- 04
2004- 05
2005- 06
7
State Per Capita Personal Income v. Share of
Adult Population with Bachelor's Degree or Higher
No state with a low proportion of Bachelors
degrees has a high per capita income.
States with high proportion of bachelors degrees
States with low proportion of bachelors degrees
Outlier state that has high income and low degree
attainment
No state with a high proportion of Bachelors
degrees has a low per capita income.
Nationally, more than one-quarter (27.2 percent)
of adults 25 and older have a bachelors degree
or more, compared to Oklahoma at 22.2 percent.
8
Degrees Conferred by Oklahoma Public Colleges
and Universities
Source Brain Gain Report
In 2006-07, State System institutions awarded a
total of 23,962 associate and bachelors degrees
the most awarded in a single year in state
history
23,962
26
Number of Associate and Bachelors Degrees
Conferred
This is 26 percent more degrees awarded than in
2000-2001.
2000-01
2001-02
2002-03
2003-04
2004-05
2005-06
2006-07
9
Employment Outcomes
What percentage of Oklahoma residents and
non-Oklahoma residents who graduate from public
colleges and universities remain in Oklahoma?
10
Employment Outcomes After One Year
Source 2008 Employment Outcomes Report
100
90
80
Percent of Graduates Employed In State After One
Year
70
60
50
40
2002-03
2005-06
11
Employment Outcomes After Five Years
Source 2008 Employment Outcomes Report
90
80
70
Percent of Graduates Employed In State After Five
Years
60
50
40
30
1998-99
2001-02
12
Economic Impact
- For every state appropriated dollar spent on
higher education in Oklahoma an additional 5.15
is pumped into the Oklahoma economy. - In 2008 Oklahomas system of higher education
will produce over 3.2 billion in growth in the
states gross domestic product - In 2008 higher educations capital and
construction spending are expected to add 23,750
jobs to the Oklahoma economy - By the end of the next decade, Oklahomas gross
state product (GSP) will increase by 26.292
billion through higher educations continued
contribution to the economy
13
Challenges AheadHigher Educations Percent of
Total State Appropriations
21
18.6
18
16.1
15.8
15.6
15.4
15
14.9
15
9
6
3
1985
1990
1995
2000
2005
2009
1980
14
Percentage of the higher education budget paid
with state appropriations
100
75.3
75
69.3
49.5
50
25
1988
1990
2008
15
Why?
- The two primary reasons are
- Health Care Cost Increases
- Corrections
16
The Oklahoma State System of Higher
EducationPutting Families FirstHigher
Educations Tuition Freeze Plan
- 80.4 million through statewide funding formula
- Ability to freeze tuition and mandatory fees at
current level for the 2009-10 academic year. - Focuses on operational fixed costs and other
institutional priorities required to provide a
quality higher education.
17
Economic Development
- 4.9 million for Endowed Chair Program debt
service obligation
- Only one-half of the required debt service funds
for the 100 million bond issue passed in 2008
was appropriated. - First debt service payment is due on June 30,
2009.
18
Removal of Financial Barriers
- 1.4 million for financial aid programs to ensure
continued access to higher education.
- Academic Scholars
- Concurrent Enrollment
- Reach Higher Program
- Cooperative Alliance Fee Waivers
- Regional University Baccalaureate Scholarships
19
Additional Legislative Requests
- 1. Oklahomas Promise 54,000,000
- 3. CLASS Task Force Initiatives (Campus Security
and Safety) 16,000,000 - funded through Homeland Security
- 4. EDGE Endowment Critically important to have
additional deposits to match federal funding and
to solidify the states position as Research
Capital of the Plains.
20
System EfficienciesAdministrative Cost Budget
Caps FY09
4 Year Institutionsbelow 3500 FTE
2 Year Institutionsbelow 3500 FTE
16
2 Year Institutionsabove 3500 FTE
4 Year Institutionsabove 3500 FTE
14
12
ResearchInstitutions
10
8
6
4
2
Cap/Actual
Cap/Actual
Cap/Actual
Cap/Actual
Cap/Actual
21
System EfficienciesTotal System Administrative
Costs FY92-FY09
14
11.9
12
11.1
10
9.3
8.3
8.2
8.2
8.1
8.1
7.9
8
7.8
System Admin Costs as a Percent of Total Budget
6
4
2
0
FY92
FY94
FY96
FY98
FY00
FY04
FY06
FY08
FY09
FY02
22
Efficiencies Percent of E-Learning Instruction
at Four-Year Institutions
Source SREB State Data Exchange Report
December 2008
15.3
12.6
8.4
7.4
6
5.9
5.8
Maryland
5.3North Carolina
5.2Mississippi
West Virginia
Kentucky
Arkansas
Alabama
4.8Texas
4.5Delaware
Oklahoma
3.1Georgia
2.9Louisiana
23
Efficiencies Percent of E-Learning Instruction
at Two-Year Institutions
Source SREB State Data Exchange Report
December 2008
16.8
16.2
14.7
Kentucky
North Carolina
24
FY 2010 Cost Savings Analysis
- Oklahoma institutions of higher education have
implemented and developed cost savings
initiatives that will have a total annual savings
of 46.2 million once fully implemented. - Cost saving initiatives focus primarily on the
following programs - Alternative Energy Sources Wind Energy at OU
and CNG at OSU - Energy Saving Programs through performance
contracts - FTE reduction through attrition
- Flexible work schedules in summer months (four
day work week) - Reduction in gasoline consumption with
institutional vehicles - Increase in use of distance learning
- Technology via OneNet
25
OKLAHOMA STATE REGENTS FOR HIGHER EDUCATION
Recommended
