
Figure 4'1' Using the cumulative distribution function PowerPoint PPT Presentation
1 / 5
Title: Figure 4'1' Using the cumulative distribution function
1
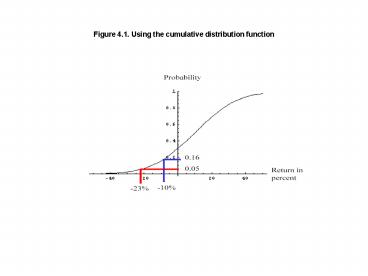
Figure 4.1. Using the cumulative distribution
function
2
Figure 4.2. Frequency distribution of two
portfolios over one year horizon
3
Figure 4.3. Normal and lognormal density and
cumulative distribution functions
Panel A. Density distribution functions
4
Figure 4.3. Normal and lognormal density and
cumulative distribution functions
Panel B. Cumulative distribution functions
5
Figure 4.4. VaR as a function of trade size
Recommended
