
The Power of the Picture Visual Thinking and Communication in Science PowerPoint PPT Presentation
Title: The Power of the Picture Visual Thinking and Communication in Science
1
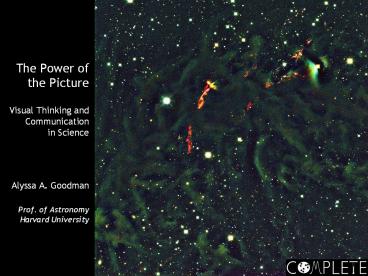
The Power of the PictureVisual Thinking and
Communication in Science
- Alyssa A. Goodman
- Prof. of Astronomy Harvard University
2
The Power of the Picture
- Visual Explanations, Visual Metaphors
- Overlaying Graphical Elements on Images
- Scale Context
- More Dimensions
- Misrepresentations Interpretations
- PowerPoint to Printed PageColorLayeringFades
Animations - Interactivity
3
Visual Explanations, Visual Metaphors
4
Optical
Near-Infrared
5
The Trick to Seeing through the Darkness
Observe at a Wavelength LARGER than the Typical
Dust Grain!
lt0.1 micron, a.k.a. Optical BAD
Dust on Your Coffee Table (10 million million
atoms)
gt0.1 micron, a.k.a. (Near) Infrared GOOD
6
Visualization Challengesin Astrophysics
- Alyssa A. Goodman
- Harvard-Smithsonian Center for Astrophysics
visual by Abby Schwartz Nina Cragg
7
Speeding Young Star
Goodman Arce 2004 Figure 1
PV Ceph The Movie
8
(No Transcript)
9
Overlaying Graphical Elements on Images
10
Speeding Young Star
Goodman Arce 2004 Figure 1
PV Ceph The Movie
11
Scale Context
12
Which Stars are Made Where, When, and How?
?
13
A Super(paramagnetic) Storya.k.a.Dont
delete thePetri dish!
14
More Dimensions
15
Measuring Motions Molecular Line Maps
16
Radio Spectral-line Observations of Interstellar
Clouds
Radio Spectral-Line Survey
Alves, Lada Lada 1999
17
Velocity from Spectroscopy
Observed Spectrum
Telescope ? Spectrometer
1.5
1.0
Intensity
0.5
0.0
-0.5
All thanks to Doppler
400
350
300
250
200
150
100
"Velocity"
18
Velocity from Spectroscopy
Observed Spectrum
Telescope ? Spectrometer
1.5
1.0
Intensity
0.5
0.0
-0.5
All thanks to Doppler
400
350
300
250
200
150
100
"Velocity"
19
Whats Done?
20
Misrepresentations Interpretations
21
(No Transcript)
22
The Other
23
(No Transcript)
24
PowerPoint to Printed Page
- Color
- Layering
- Fades
- Animation
25
Barnards Perseus
26
Dust Density Dust Temperature in Perseus
Dust Temperature (25 to 45 K) (Based on 60/100
microns)
Total Dust Column (0 to 15 mag AV) (Based on
60/100 microns)
27
Hot Source in a Warm Shell
Schnee et al. 2005 Ridge et al. 2005
IRAS Column Density
IRAS Temperature
28
PowerPoint to Printed Page
Contours show blue (density) information from
left panel
Ridge et al. 2005
29
H-? emission,WHAM/SHASSA Surveys (see Finkbeiner
2003)
30
Why COMPLETE?
Schnee et al. 2005 Ridge et al. 2005
IRAS Column Density
IRAS Temperature
NICER Extinction Map Alves, Lombardi
Foster 2005
31
Why COMPLETE?
Schnee et al. 2005 Ridge et al. 2005
IRAS Column Density
IRAS Temperature
NICER Extinction Map Alves, Lombardi
Foster 2005
32
The Value of the Fade
HH 46-47 flow poking out of a globule, optical
(DSS)
33
Animation
34
Animationof the Formation of a Cluster of Stars
Bate, Bonnell Bromm 2002
35
PV Ceph for Professional Astronomers (in 7
min)(including The Movie)
36
Interactivity
- Astronomical Medicine Demo
37
Whats Done?
38
(No Transcript)
39
Extra Slides
40
The Value of COMPLETE Observations B68
Coordinated Molecular-Probe Line, Extinction
Thermal Emission Observations of Barnard 68 This
figure highlights the work of Senior Collaborator
João Alves and his collaborators. The top left
panel shows a deep VLT image (Alves, Lada Lada
2001). The middle top panel shows the 850 ?m
continuum emission (Visser, Richer Chandler
2001) from the dust causing the extinction seen
optically. The top right panel highlights the
extreme depletion seen at high extinctions in
C18O emission (Lada et al. 2001). The inset on
the bottom right panel shows the extinction map
derived from applying the NICER method applied to
NTT near-infrared observations of the most
extinguished portion of B68. The graph in the
bottom right panel shows the incredible
radial-density profile derived from the NICER
extinction map (Alves, Lada Lada 2001). Notice
that the fit to this profile shows the inner
portion of B68 to be essentially a perfect
critical Bonner-Ebert sphere
41
Visualization courtesy American Museum of Natural
History, Hayden Planetarium
42
(No Transcript)
43
Orion Constellation Movie
Recommended
