

Time-Variable Complex Metal Absorption Lines in the Quasar HS1603 3820 PowerPoint PPT Presentation
1 / 1
Title: Time-Variable Complex Metal Absorption Lines in the Quasar HS1603 3820
1
Time-Variable Complex Metal Absorption Lines in
the Quasar HS16033820 Toru Misawa, Michael
Eracleous, Jane C. Charlton (Penn State
University), Akito Tajitsu (NAOJ)
1. SUMMARY We present five spectra of the quasar
HS16033820 (zem2.542) taken over a 0.2-1.6 year
intervals (0.7-5.4 months in the quasar rest
frame) with the High Dispersion Spectrograph on
the Subaru telescope, for the purpose of
identifying intrinsic narrow absorption lines
(NALs). This quasar shows a rich complex of C IV
NALs near the emission redshift (dN/dz 12). We
perform time variability analysis as well as
covering factor analysis to separate intrinsic
NALs, which are physically related to the quasar,
from intervening NALs in 8 C IV systems. Only one
of them at zabs2.43 shows both partial coverage
and large variation in line strength, width, and
position. Assuming that a change of ionization
state causes the variability, a lower limit can
be placed on the electron density (ne gt 3.2x10⁴
cm-3) and an upper limit on the distance from the
continuum source (r lt 6 kpc). On the other hand,
if the motion of clumpy gas causes the
variability, the crossing velocity and the
distance from the continuum source are estimated
to be ?cross gt 8,000 km s-1 and r lt 3 pc,
assuming that the observed shift velocity does
not exceed the escape velocity at that radius. If
we adopt the dynamical model of Murray et al.
(1995), we can obtain a much strict constraint on
the radius of the gas parcel, r lt 0.2 pc. We are
planning to monitor this quasar for a several
years to use intrinsic absorbers behavior as a
direct check of wind models, and make more
sophisticated models.
2. DATA ANALYSIS
Covering factor analysis the covering factor, Cf
, represents the fraction of photons from the
background source(s) that are absorbed by the
absorber (e.g., Wampler et al. 1995). For
resonant doublets such as C IV, N V, and Si IV,
we can evaluate Cf , by using the residual fluxes
of the blue and red members of the doublets (Rb
and Rr) in the normalized spectrum.
Time variability analysis the detection of
variability of the strength, profile, or position
of absorption lines is also a reliable indicator
of intrinsic NALs. There are at least two causes
of variability (1) Change of ionization state
(Hamann et al. 1997) Supposing that the gas
is in ionization equilibrium, we can calculate
electron density of absorber (ne) from the
recombination time (i.e., variability time,
trecom see eqn.(2)), where ai-1 is the rate
coefficient for recombination from the stage i
to the next lower stage i-1. If we know an
ionization parameter, it is also possible to
estimate the distance of the absorber (r) from
the continuum source (e.g., Narayanan et al.
2004 eqn.(3)), where ?LL is the wavelength
at the Lyman limit.
(2)
(blue member)
(3)
(red member)
(2) Motion of the absorption gas across the line
of sight (e.g., Misawa et al. 2005) Assuming a
clumpy gas crossing the background source,
we can estimate the crossing velocity (?cross)
as eqn (4), where R is the size of the
background source, and Cf (1) and Cf (2) are
the covering factors in the observed spectra
(see Figure 1).
QSO
absorber
(4)
In the case of resonance doublet lines such as
CIV, NV, and SiIV, fb/fr 2 and ?b?r .
(1)
3. RESULTS
We found 48 C IV, 15 SiIV, and 6 N V doublets, as
well as 54 single metal lines in 8 absorption
systems. Among them, only one system at zabs2.42
2.45 (?ej8,300 10,600 km s-1) shows both
partial coverage (Figure 2) and time variability
(Figure 3). This system has many broad C IV
components, which make the line profile very
difficult to decompose into kinematic components.
Therefore, we concentrate on the region at
5290-5315Å (Figure 4) which can be decomposed
relatively simply. We found covering factors of
0.30 and 0.45 for the 1st (March 2002) and 2nd
(July 2003) spectra, respectively.
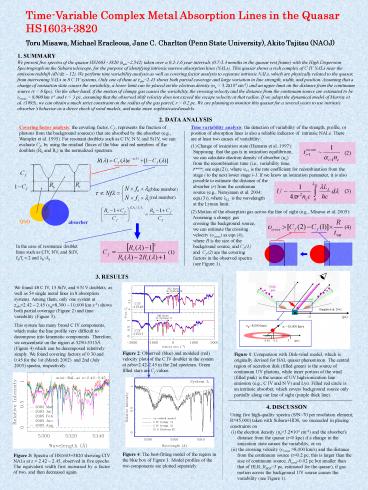
Figure 2 Observed (blue) and modeled (red)
velocity plots of the C IV doublet in the system
at zabs2.42-2.45 in the 2nd spectrum. Green
filled stars are Cf values.
Figure 1 Comparison with Disk-wind model, which
is originally devised for BAL quasar phenominon.
The central region of accretion disk (filled
green) is the source of continuum UV photons,
while inner portion of the wind (filled pink) is
the source of UV high-ionization line emission
(e.g., C IV and N V) and Lya. Filled red circle
is an intrinsic absorber, which covers background
source only partially along our line of sight
(purple thick line).
4. DISCUSSON
Using five high-quality spectra (S/N70 per
resolution element R45,000) taken with
SubaruHDS, we succeeded in placing constraints
on (i) the electron density (negt3.2104 cm-3)
and the absorber's distance from the
quasar (rlt6 kpc) if a change in the
ionization state causes the variability, or on
(ii) the crossing velocity (?cross gt8,000 km/s)
and the distance from the continuum source
(rlt0.2 pc this is larger than the size of
continuum source, Rcont0.02 pc but smaller than
that of BLR, RBLR3 pc, estimated for the
quasar), if gas motion across the
background UV source causes the
variability (see Figure 1).
Figure 4 The best-fitting model of the region in
the blue box of Figure 1. Model profiles of the
two components are plotted separately.
Figure 3 Spectra of HS16033820 showing CIV NALs
at z 2.42 2.45, observed in five epochs. The
equivalent width first increased by a factor of
two, and then decreased again.
Recommended

