GIS database development PowerPoint PPT Presentation
1 / 1
Title: GIS database development
1
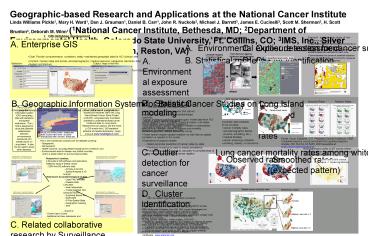
Geographic-based Research and Applications at the
National Cancer Institute Linda Williams Pickle1,
Mary H. Ward1, Dan J. Grauman1, Daniel B. Carr1,
John R. Nuckols2, Michael J. Barrett3, James E.
Cucinelli3, Scott M. Sherman3, H. Scott Brunton4,
Deborah M. Winn1 (1National Cancer Institute,
Bethesda, MD 2Department of Environmental
Health, Colorado State University, Ft. Collins,
CO 3IMS, Inc., Silver Spring, MD, 4Titan
Corporation, Reston, VA)
- GIS database development
- Example epidemiologic study of non-Hodgkins
lymphoma (NHL) - Mapped residences, then assessed proximity of
residences to specific crop - Assigned probabilities of exposure based on
available pesticide use data for each crop - Demonstrated that zones of potential exposure to
agricultural pesticides and proximity measures
can be determined for residences
- A. Enterprise GIS
- Goal Provide comprehensive, consistent, easily
maintained geospatial data for NCI division staff
- Content Cancer rates and trends
sociodemographic, medical resource, behavioral
risk factor data - System architecture
- Visual Basic Form called from a VB .NET dll from
within ArcMap - This program makes an internet call to a PHP
program which retrieves data from Sybase database - Resulting text file is written to users hard
drive, joined to shapefile
- A. Environmental exposure assessment
- GIS can provide information about potential
environmental exposures that cannot be obtained
through traditional epidemiologic methods - Study in south central Nebraska demonstrated use
of satellite imagery to reconstruct historical
crop patterns - Ward et al. Env Health Perspectives,2000
Selection
Output map or text file
Map accuracy Corn 90 Soybeans 75 Sorghum 75
NCI cancer registries
B. Geographic Information System for Breast
Cancer Studies on Long Island A Resource for
researchers and the public interested in breast
cancer patterns on Long Island
- B. Statistical modeling
- Cancer incidence prediction project goal model
data from NCI cancer registries (470 counties),
predict cases in all states - Use hierarchical Poisson regression models to
characterize associations between cancer
incidence and mortality, sociodemographic,
lifestyle factors by county - These factors explain spatial variation so well
that no spatial correlation is needed in the
model - Extensions of original models
- Spatio-temporal prediction of cancer rates by
state - Predicted incidence is used to predict
prevalence - Predicted incidence is used to calculate
completeness of case ascertainment for each
cancer registry
Output Predicted incidence rates
Absolute Rates
Relative Rates
Smoothed by county
Geographic Extent of LI GIS
The LI GIS is a geographic information system
(GIS) comprising data with statistical and
spatial extensions. The LI GIS is designed to
study the potential relationships between
environmental exposures and breast cancer on Long
Island. It also can be used to study other
diseases.
The LI GIS is one of a series of major studies
and initiatives within the Long Island Breast
Cancer Study Project (LIBCSP), congressionally
mandated activities to understand breast cancer
incidence rates on Long Island. Researchers can
apply to use the entire LI GIS and/or the LI GIS
statistical software and spatial extensions.
Apply online at www.healthgis-li.com
Female breast cancer
- Covariate data available
- for all counties
- cancer mortality rates
- sociodemographic factors
- (income, schooling, etc.)
- medical facilities
- cancer screening utilization
- smoking, obesity, no insurance
Pickle, Feuer, Edwards. U.S. Predicted Cancer
Incidence, 1999 Complete maps by county and
state from spatial projection models. NIH Pub No
03-5435, 2003 (available at srab.cancer.gov/incide
nce)
The LI GIS warehouse contains over 80 datasets
covering - Topographic - Demographic -
Health outcome, including relative breast cancer
incidence and - Environmental data for Nassau
and Suffolk counties, and to a lesser extent
on surrounding counties.
Most significant outlier is MT county where a
copper smelter had polluted air with arsenic (Lee
Fraumeni, JNCI, 1969)
- C. Outlier detection for cancer surveillance
- Can we detect significant outliers (unusual
occurrences) of the of new cancer cases? - Applied an empirical Bayes data mining algorithm
to test data (DuMouchel Pregibon, Proc KDD,
2001 Lincoln Technologies, Inc) - Method assumes Poisson distribution of cases,
estimates Relative Risk observed/expected - Lung cancer mortality, white males, 1950-69
- Smoothed map provided expected cases per
county - Algorithm compared actual cases to this
expectation - Found known hot spot in MT, site of copper
smelter
Lung cancer mortality rates among white males,
1950-69
Observed rates
Smoothed rates (expected pattern)
Arial interpolator interpolating zip
code Population from census tract population
Disease rate calculator calculating
directly- Adjusted rate for selected census tracts
Researchers toolbox A full suite of GIS
software and extensions related to study of
breast cancer - ESRI ArcGIS software suite -
ArcView ArcInfo - Spatial Analysis 3D
Analyst Extensions for epidemiological studies
- Case File Formatter - Disease Rate
Calculator - Areal Interpolator - Cluster
Analysis Tool (using SaTScan) - Empiricial
Bayes Tool - EpiAnalyst - S-Plus Spatial
Stats - Geographic masking - SAS - Oracle
9i - Online Users Guide - Additional ArcView
extensions and software
Lower limit of 95 interval Value 1 implies
significance
- D. Cluster identification
- Are apparent map clusters real or random noise?
- SaTScan software identifies most likely
significant cluster over space, time or both - Algorithm spatial scan statistic for Poisson or
Bernoulli event data, adjusts for population
heterogeneity covariates - Originally identified circular clusters, new
version scans for elliptical clusters, various
shapes angles - Software www.satscan.org
- Recently extended to clusters of survival rates
- Developed by Martin Kulldorff Stat in Med, 1995,
1996 Communications in Statistics, 1997 Am J
Epidemiology, 1997 Am J Public Health, 1998
Empirical Bayes Tool stabilizes data. Deals
with small numbers issues for local data
Cluster analysis checking for clusters
of Sample cases in Suffolk County (SaTScan)
C. Related collaborative research by
Surveillance, Epidemiology End Results (SEER)
cancer registries (Rapid Response Surveillance
Studies) - Development of high resolution
population distribution data for cancer
control - Assessment of the accuracy of
geocoding by geographic scale, impact of errors
on cancer rates

