
Lorenz Curve and Gini Coefficient PowerPoint PPT Presentation
Title: Lorenz Curve and Gini Coefficient
1
The Lorenz Curve
2
Lorenz Curve
Population Income
0 0
10 2
20 5
30 8
40 12
50 17
60 24
70 33
80 47
90 66
100 100
- The Lorenz Curve shows the equality of income
distribution. - The further the curve lies from the line of
equality the less even income distribution is.
3
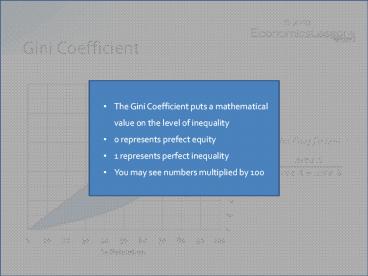
Gini Coefficient
- The Gini Coefficient puts a mathematical value on
the level of inequality - 0 represents prefect equity
- 1 represents perfect inequality
- You may see numbers multiplied by 100
A
B
4
UK Data
5
UK Gini Coefficient
Recommended
