
Mountain Pine Beetle Detection and Monitoring: Remote Sensing Evaluations PowerPoint PPT Presentation
1 / 47
Title: Mountain Pine Beetle Detection and Monitoring: Remote Sensing Evaluations
1
Mountain Pine Beetle Detection and Monitoring
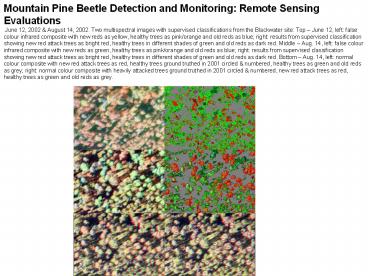
Remote Sensing Evaluations June 12, 2002
August 14, 2002. Two multispectral images with
supervised classifications from the Blackwater
site Top June 12, left false colour infrared
composite with new reds as yellow, healthy trees
as pink/orange and old reds as blue right
results from supervised classification showing
new red attack trees as bright red, healthy trees
in different shades of green and old reds as dark
red. Middle Aug. 14, left false colour
infrared composite with new reds as green,
healthy trees as pink/orange and old reds as
blue right results from supervised
classification showing new red attack trees as
bright red, healthy trees in different shades of
green and old reds as dark red. Bottom Aug. 14,
left normal colour composite with new red attack
trees as red, healthy trees ground truthed in
2001 circled numbered, healthy trees as green
and old reds as grey right normal colour
composite with heavily attacked trees ground
truthed in 2001 circled numbered, new red
attack trees as red, healthy trees as green and
old reds as grey.
2
Mountain Pine Beetle Detection and Monitoring
Remote Sensing Evaluations
3
WHO
- Principal Investigator
- Arthur Roberts
- Professor, Department of Geography, Simon Fraser
University - Editor, International Journal or Remote Sensing
- Background
- Flying aerial imagery since 1973
- Specialized in airborne electro optical
multispectral imaging since 1984 - Emphasis on knowledge transfer for resource
management since 1996 - SFU Remote Sensing Laboratory Research Resources
- Aircraft
- Cessna 185C (turbo photo conversion) aircraft for
aerial survey complete with optical port glass,
24 volt electrics and camera port modifications. - Imaging Systems
- International Imaging Systems 24cm 4 band
multispectral camera. - Fairchild T-11 24cm mapping cameras (2),
Metrogon II 153mm f. 6.3 lenses - Vinten 70mm motor driven reconnaissance cameras
(4)(90mm and 150mm lenses). - Nikon F-250 motor driven reconnaissance cameras
(2) (24mm and 50mm lenses). - XC-7500 progressive scan CCD camera (3) airborne
digital frame imaging system. - XC-75 CCD VIFIS imaging spectrometers (2),
visible and near infrared. - 900nm eyesafe Lidar for low altitude vertical
profiles.
4
MPB
- Research Objective
- Develop an applied remote sensing strategy for
resource management of BC forests and forest
health. - Emphasis
- Mountain Pine Beetle Infestations
- identification and mapping of (1) early
infestation (current attack), (2) subsequent
advanced stages (including detection and mapping
of red attack) and (3) monitoring spread across
time - Criteria
- Efficiency cost effective
- practical and robust
- reliable
- Private sector competitive bidding
- Knowledge transfer direct industry use
- General utility other applications
5
Research Imagery
- Four band multispectral image of Deerhorn site,
August 14, 2002. Image 1 blue Image 2 green
Image 3 red Image 4 nir. - Each multispectral image contains four spectral
bands (near infrared (NIR), red, green and blue)
that were combined digitally into 4 colour
composites (Figure 2) normal colour, colour
infrared and two false colour infrared images for
visual and computer analysis and classification.
The twin camera imagery consisted of two images
(Figure 3) colour with colour infrared and colour
with BW infrared. These data were digitally
converted and evaluated to determine varying
levels of interpretational utility and spatial
resolution performance for forestry health
parameters. In addition the colour and false
colour digitally converted aerial images were
used as a comparative baseline to assist with the
performance evaluation of the multispectral
imagery.
6
Research Imagery
- Imagery Registration
- Both the multispectral and twin camera imagery
required registration of each individual image to
a single image. - For the multispectral imagery the NIR, red and
blue images were registered to the green image. - With the twin camera imagery the infrared imagery
(colour IR and BW IR) was registered to the
normal colour imagery. - This cross-image spectral band registration
created sets of 4 band and 6 band multispectral
imagery for enhancement, interpretation and
classification. In all instances one of the
images was left unaltered to permit precision
photogrammetric mapping.
7
Research Imagery
- Figure 2a Four different colour composite images
using Figure 1 spectral bands. Top L RGB Top R
IRRG Lower L IRRB Lower R RIRB.
8
Research Imagery
- Figure 2b An enlarged area from Figure 2a. Red
attack trees are red on RGB RIRB and green on
IRRG IRRB. TLRGB TRIRRG LLIRRB LRRIRB.
9
Research Imagery
- Figure 3a Twin camera colour composite
multispectral imagery Deerhorn site, October 16,
2002.TLRGB TRIRRG LLIRRB LRRIRB.
10
Research Imagery
- Figure 3b An enlarged area from Figure 3a. Red
attack trees are red on RGB RIRB and green on
IRRG IRRB. TLRGB TRIRRG LLIRRB LRRIRB.
11
Figure 8 Nazko 2003 normal colour imagery
(enlarged area at bottom) Left June 4, 2003
colour negative image Right June 6,
2003 multispectral image.
12
Ground Truth trees at the Blackwater site. All
ground truthed trees (614) are circled, numbered
and keyed to a table. Ground truth was undertaken
by MOF in November-December 2001 and SFU/MOF in
November 2002.
13
Blackwater Site confusion matrix of supervised
classificationsAugust 14 2002
14
Blackwater Site Multispectral Imagery
Supervised ClassificationsAugust 14 2002
15
Blackwater Site confusion matrix of supervised
classificationsJune 12 2002
16
Blackwater Site Multispectral Imagery
Supervised ClassificationsTop June 12 2002
Bottom August 14 2002
17
Blackwater Site confusion matrix of supervised
classificationsJune 3 2002
18
Blackwater Site Multispectral Imagery
Supervised ClassificationsTop June 3 2002
Bottom August 14 2002
19
Blackwater Site confusion matrix of supervised
classificationsMay 15 2002
20
Blackwater Site Multispectral Imagery
Supervised ClassificationsTop May 15 2002
Bottom August 14 2002
21
Blackwater Site confusion matrix of supervised
classificationsApril 3 2002
22
Figure 7a 2M13 Site Top May 29, 2003 Left -
RGB multispectral colour composite with 2002 reds
(red), fading trees (yellow-green), healthy
trees (green) and old reds (deep red/grey)
middle supervised classification with 2002 reds
as red, fading trees as yellow, healthy trees
as green and old reds as deep red Right - August
2002 image showing ground truth trees for this
area. Bottom July 26, 2003 Left - RGB
multispectral colour composite with new reds
(red), healthy trees (green) and old reds (deep
red/grey) middle supervised classification
with new reds as red, fading trees as yellow,
healthy trees as green and old reds as deep red
Right - August 2002 image showing ground truth
trees for this area.
23
Figure 7b 2M13 Site Top June 6, 2003 Left -
RGB multispectral colour composite with 2002 reds
(red), fading trees (yellow-green), healthy
trees (green) and old reds (deep red/grey)
middle supervised classification with 2002 reds
as red, fading trees as yellow, healthy trees
as green and old reds as deep red Right - August
2002 image showing ground truth trees for this
area. Bottom July 26, 2003 Left - RGB
multispectral colour composite with new reds
(red), healthy trees (green) and old reds (deep
red/grey) middle supervised classification
with new reds as red, fading trees as yellow,
healthy trees as green and old reds as deep red
Right - August 2002 image showing ground truth
trees for this area.
24
Figure 7c 2M13 Site Top July 11, 2003 Left -
RGB multispectral colour composite with 2002 reds
(red), fading trees (yellow-green), healthy
trees (green) and old reds (deep red/grey)
middle supervised classification with 2002 reds
as red, fading trees as yellow, healthy trees
as green and old reds as deep red August 2002
image showing ground truth trees for this
area. Bottom July 26, 2003 Left - RGB
multispectral colour composite with new reds
(red), healthy trees (green) and old reds (deep
red/grey) middle supervised classification
with new reds as red, fading trees as yellow,
healthy trees as green and old reds as deep red
August 2002 image showing ground truth trees for
this area.
25
Figure 7d 2M13 Site Top September 30, 2003
Left - RGB multispectral colour composite with
2002 reds (red), fading trees (yellow-green),
healthy trees (green), healthy aspen (yellow) and
old reds (deep red/grey) middle supervised
classification with 2002 reds as red, fading
trees as yellow, healthy trees as green, healthy
aspen as green/yellow and old reds as deep red
August 2002 image showing ground truth trees for
this area. Bottom July 26, 2003 Left - RGB
multispectral colour composite with new reds
(red), healthy trees (green) and old reds (deep
red/grey) middle supervised classification
with new reds as red, fading trees as yellow,
healthy trees as green and old reds as deep red
August 2002 image showing ground truth trees for
this area.
26
2M13 Site Blind May 29 classifications against
ground truth predictions Values across the top
are taken from the blind imagery classifications
for May 29/03. Values down the left side are from
ground predictions.
Note 12 Healthy not correctly classified
were verified as 4 red, 2 yellow and 6 old red
conclusion incorrect ground predictions 12 New
Mortality not correctly classified were verified
as 11 green and 1 old red conclusion incorrect
ground predictions. 1 2002 Red not correctly
classified was verified as 1 yellow (fading)
conclusion incorrect ground predictions. 2 pre
2002 mortality not correctly classified were
verified as 1 red and 1 green conclusion
incorrect ground predictions.
27
2M13 Site Blind July 11 classifications against
ground truth predictions Values across the top
are taken from the blind imagery classifications
for July 11/03. Values down the left side are
from ground predictions.
Note Similar problems as above all
misclassifications are a result of inaccurate
ground truth predictions.
28
2M13 Site Blind July 26 classifications against
ground truth predictions Values across the top
are taken from the blind imagery classifications
for July 26/03. Values down the left side are
from ground predictions.
Note These results are identical with our May
29th results above i.e. 12 Healthy not
correctly classified were verified as 4 red, 2
yellow and 6 old red conclusion incorrect
ground predictions 12 New Mortality not
correctly classified were verified as 11 green
and 1 old red conclusion incorrect ground
predictions. 1 2002 Red not correctly
classified was verified as 1 yellow (fading)
conclusion incorrect ground predictions. 2 pre
2002 mortality not correctly classified were
verified as 1 red and 1 green conclusion
incorrect ground predictions.
29
2M13 Site Blind May 29 classifications against
July 26 imagery results Values across the top
are taken from the blind imagery classifications
for May 29/03. Values at left are from July 26th
imagery predictions.
Note 100 new mortality accuracy.
30
2M13-2 Site Blind May classifications against
late July imagery results Values across the top
are taken from the blind imagery classifications
for May 29/03. Values at left are from July 26th
imagery predictions.
Note 100 new mortality accuracy.
31
Nazko-2 Site Blind May classifications against
late July imagery results Values across the top
are taken from the blind imagery classifications
for May 29/03. Values at left are from July 26th
imagery predictions.
Note 100 new mortality accuracy but we have
reduced healthy accuracy (91.6) because on our
July 26th imagery these 20 healthy trees are red
and clearly new mortality. By June 6 (one week
later see below) we obtain 100 classification
accuracy on the same trees. Visual inspection of
the late May imagery shows that these trees were
starting to fade.
32
Nazko-2 Site Blind June classifications against
late July imagery results Values across the top
are taken from the blind imagery classifications
for June 6/03. Values at left are from July 26th
imagery predictions.
Note 100 new mortality accuracy.
33
Nechako Site Blind May classifications against
July imagery results Values across the top are
taken from the blind imagery classifications for
May 29/03. Values at left are from July 26th
imagery predictions.
Note 73.5 new mortality accuracy.
34
Nechako Site Blind June classifications against
July imagery results Values across the top are
taken from the blind imagery classifications for
June 6/03. Values at left are from July 26th
imagery predictions.
Note 95.9 new mortality accuracy.
35
Nechako Site Blind July 11 classifications
against July 26 imagery results Values across
the top are taken from the blind imagery
classifications for July 11/03. Values at left
are from July 26th imagery predictions.
Note 100 new mortality accuracy
36
Sample MPB detection and monitoring imagery for
the 2M13 Site, May 2002 to September 2003.
Imagery taken with International Imaging Systems
multispectral camera using 89b (NIR), 25 (R), 46
(B) and 57 (G) filters and Agfa 200 PE 1 and 400
PE 1 extended red film scanned at 18 microns. All
imagery was flown at 18000 or 116000. Only
normal colour multispectral (RGB) imagery is
shown for each date. Left Ground truthed
trees at the 2M13 site on Aug 14/02 image. Right
August 14 colour image showing GT area and
surroundings.
37
May 15, 2002, normal colour center old red
attack (ground truth area), fading current
attack.
38
June 3, 2002, normal colour lower center old
reds fading current attack.
39
June 12, 2002, normal colour center old reds
fading yellowing current attack.
40
August 14, 2002, normal colour center left
old reds current red attack with some still
fading yellowing.
41
May 29, 2003, normal colour center (ground
truth area) lower right old red attack
fading current attack.
42
June 6, 2003, normal colour center old red
attack yellowing current attack.
43
July 11, 2003, normal colour old red attack
current red attack.
44
July 26, 2003, normal colour old red attack
current red attack.
45
September 30, 2003, normal colour new old
red attack and deciduous trees undergoing
senescence (yellow).
46
MPB
- Results
- Digitally converted multispectral aerial
photography (photogrammetric conversion at
approximately 14 - 22 microns) performs best for
early detection of current attack and mapping and
monitoring red attack. - A spreading current attack can be reliably
detected between mid May and early June at our
sites. - For mapping red attack a scale smaller than
116000 (120000 140000) is recommended at
this time. - For early detection experiments, 18000 imagery
was superior but 116000 imagery would be
operationally effective. - Aerial photography (multispectral and digitally
converted) is clearly the remote sensing imaging
system that can most accurately and cost
effectively addresses this critical MPB problem.
Of equal importance is the capability of aerial
photography being implemented in a timely fashion
by both government and private sector in a
business environment using competitive tendering
(twin camera option).
47
Acknowledgement
- Research was jointly funded by the BC Ministry of
Forests, West Fraser Mills Ltd. and Forestry
Innovation Investment. Without this support the
project would not have been possible. We
gratefully acknowledge this assistance.
Recommended
