
Types of Graphs PowerPoint PPT Presentation
1 / 5
Title: Types of Graphs
1
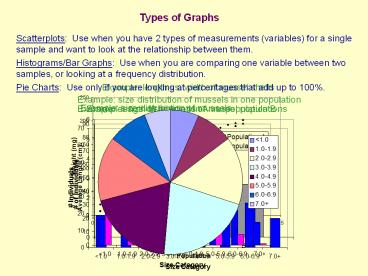
Types of Graphs
Scatterplots Use when you have 2 types of
measurements (variables) for a single sample and
want to look at the relationship between them.
Histograms/Bar Graphs Use when you are
comparing one variable between two samples, or
looking at a frequency distribution.
Pie Charts Use only if you are looking at
percentages that add up to 100.
2
Summarizing Data
3
Summarizing Data Further Beyond the Mean
Sample 1
Sample 2
Mean
Standard Deviation tells you how much your data
deviate from the mean. The greater the standard
deviation, the bigger the spread of data.
St.Dev.
4
Summarizing Data Further Beyond the Mean
Sample 1
Sample 2
Stdev 0.86 1.21
Stdev 0.39 0.27
5
Using Statistics with Scatterplots
R2 tells you how well your data fit the line, or
how much variability is in your data. An R2 of 1
means that all your data points lie directly on
the line.
Recommended
