
Optical Water Mass Classification for Interpretation of Coastal Carbon Flux Processes PowerPoint PPT Presentation
Title: Optical Water Mass Classification for Interpretation of Coastal Carbon Flux Processes
1
Optical Water Mass Classification for
Interpretation of Coastal Carbon Flux Processes
R.W. Gould, Jr. R.A. Arnone
Naval Research Laboratory, Code 7333, Stennis
Space Center, MS 39529 (228-688-5587,
gould_at_nrlssc.navy.mil)
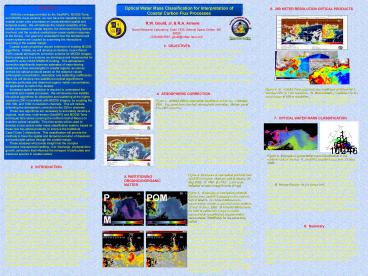
4. ATMOSPHERIC CORRECTION
Figure 1. MODIS diffuse attenuation coefficient
at 532 nm, 1 October, 2001. Top panel from
standard atmospheric correction. Bottom panel
from NIR correction.
Standard Processing
Figure 1 shows an example of the improved
chlorophyll retrievals in coastal regions after
applying the NIR correction scheme to SeaWiFS
imagery. The procedure is independent of
knowledge of the waters properties, or the
aerosol type, and can be applied to all coastal
areas as it is based on basic ocean optical
properties. The SeaWiFS results have shown a
significantly improved match up between satellite
remote sensing reflectance and the in-situ
measured reflectance. Both the NIR correction
(Arnone et al., 1998 Stumpf et al., 2003) and
the spectral scattering model (Gould et al.,
1999) we developed have been implemented in the
4th SeaWiFS reprocessing by NASA Goddard
(http//seawifs.gsfc.nasa.gov/SEAWIFS/RECAL/Repro4
/NIR.html). Our algorithm modifications have
extended estimates shoreward, enabling pixel
retrievals all the way into turbid coastal
waters, bays, and even estuaries where optical
properties are controlled by a complex mix of
phytoplankton, suspended sediments, and colored
dissolved organic matter (CDOM).
NIR -Iteration
Figure 2. Examples of new optical products from
SeaWiFS imagery. Northern gulf of Mexico, 20 May
2002. A. PIM. B. POM. Color scale indicated
on each image in units of mg/l.
5. PARTITIONING ORGANIC/INORGANIC MATTER
Figure 3. Examples of new optical products
derived from SeaWiFS imagery in the northern Gulf
of Mexico. A. Percent difference in
concentration of total suspended solids between
12 and 14 June, 2002. B. Percent difference in
the ratio of particulate inorganic matter
concentration to particulate organic matter
concentration (PIM/POM) for the same time period.
Yellow-to-red color scale in each panel
indicates pixels where the TSS concentration or
PIM/POM ratio increased over the two day period
black-to-white color scale indicates pixels where
they decreased. The changes in TSS concentration
and PIM/POM ratio indicate advection of the
Mobile Bay outflow plume as well as changes in
the composition of the particulate matter. For
example, the pixels in the circled areas (both
panels) showed an increase in the TSS load and a
decrease in the PIM/POM ratio, indicating an
increase in the organic component relative to the
inorganic component, possibly due to
phytoplankton growth or settling of suspended
sediments.
2B.
2A.
PIM
POM
3B.
3A.
Recommended
