
Demand - PowerPoint PPT Presentation
1 / 9
Title:
Demand
Description:
A tax on buyers will shift the demand curve downward by the size of the tax. ... After the tax, note the size of consumer surplus, producer surplus, tax revenue ... – PowerPoint PPT presentation
Number of Views:37
Avg rating:3.0/5.0
Title: Demand
1
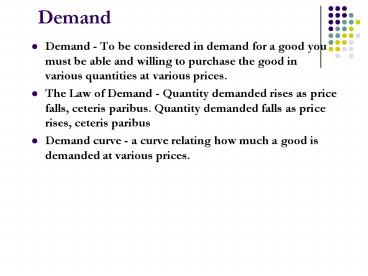
Demand
- Demand - To be considered in demand for a good
you must be able and willing to purchase the good
in various quantities at various prices. - The Law of Demand - Quantity demanded rises as
price falls, ceteris paribus. Quantity demanded
falls as price rises, ceteris paribus - Demand curve - a curve relating how much a good
is demanded at various prices.
2
Demand Factors
- Normal good - a good the demand for which rises
as income rises. - Inferior goods - a good the demand for which
falls as income rises. - Substitutes - two goods that satisfy similar
needs or desires. If two goods are substitutes
then as the price of one rises, demand for the
other good will increase. - Complements - two goods that are used jointly in
consumption. If two goods are complements then
as the price of one rises, demand for the other
good will decrease.
3
Supply
- Supply -To be considered to supply a good you
must be able and willing to produce (and sell)
the good in various quantities at various prices. - Law of Supply as the price of a good rises,
producers will supply more of the good, ceteris
paribus. - Supply curve - a curve relating how much a good
is supplied at various prices.
4
Demand and Supply Math
- P a bQ
- P c dQ
- a bQ c dQ
- (a-c) (bd)Q
- (a-c)/(bd) Q
- This is not real helpful. Just set the two
equations equal to each and solve for
equilibrium.
5
Controls on Price
- Price Ceiling - a government mandated maximum
price above which legal trades cannot be made. - Impact Creates a shortage of the good.
- Alternative rationing methods must be employed.
- Price floor - a government mandated minimum price
below which legal trades cannot be made. - Impact Creates a surplus of the good.
6
Consumer Surplus
- Willingness to Pay the maximum amount that a
buyer will pay for a good. - Consumer Surplus a buyers willingness to pay
minus the amount the buyer actually pays. - Use the demand curve to measure consumer surplus.
- NOTE Consumer surplus measures the benefits that
buyers receive from a good as the buyer
themselves perceive it.
7
Producer Surplus
- Cost the value of everything a seller must give
up to produce a good. - Producer Surplus the amount a seller is paid
for a good minus the sellers cost. - Using the supply curve to measure producer
surplus.
8
TAXES
- Tax Incidence the study of who bears the burden
of taxation - A Tax on Buyers or Sellers
- A tax on buyers will shift the demand curve
downward by the size of the tax. - A tax on sellers will shift the supply curve
upward by the size of the tax. - Lessons
- Taxes reduce output in the market
- Buyers and sellers share the burden of the tax
- The decision to tax depends upon a comparison of
the cost of taxation with the benefits of
government spending.
9
The Deadweight Loss of Taxation
- The tax may shift supply or demand, depending
upon whether the tax is placed on the producers
or the buyers. - To understand the cost of the tax, compare
welfare without the tax to welfare with the tax. - After the tax, note the size of consumer surplus,
producer surplus, tax revenue and deadweight
loss. - WHY IS THIS IMPORTANT? Later we will compare the
cost of taxation to the cost of monopoly power.
Recommended
CrystalGraphics Presentations


