
Concepts of Relations and Functions and How They are Represented PowerPoint PPT Presentation
1 / 14
Title: Concepts of Relations and Functions and How They are Represented
1
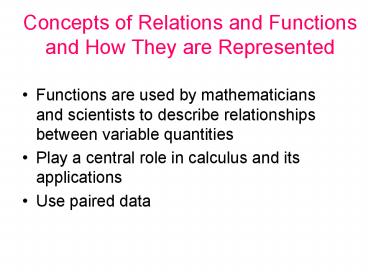
Concepts of Relations and Functions and How They
are Represented
- Functions are used by mathematicians and
scientists to describe relationships between
variable quantities - Play a central role in calculus and its
applications - Use paired data
2
Tables and Scatter Plot
3
Old Faithful Eruptions Scatter Plot
4
Line graph join the successive points
5
Histogram/Bar Graph
6
Functions
- Tables, graphs, and equations
- Provide three methods for describing how one
property depends on another - Tables - numerical Graphs - visual
- Equations - algebraic
7
A relation is a function if for each x there is
one and only one y.
A relation is a one-to-one if also for each y
there is one and only one x.
8
To be one-to-one, a function must pass the
horizontal line test as well as the vertical line
test.
one-to-one
not one-to-one
not a function
(also not one-to-one)
9
If a variable y depends on a variable x in such a
way that each value of x determines exactly one
value of y, then we say that y is a function of x.
A function f is a rule that associates a unique
output with each input. If the input is denoted
by x, then the output is denoted by f(x) (read f
of x).
Functions are represented four basic ways 1)
Numerically by tables 2) Geometrically by
graphs 3) Algebraically by formulas 4) Verbally
10
Curve fitting
Converting numerical representations of functions
into algebraic formulas
11
Discrete vs Continuous Data
- Discrete Data Data that makes discrete jumps.
Data represented by scatter plots consisting of
isolated points. Data that has a finite number of
values and there is space on a number line
between 2 possible values. Usually whole
numbers. - Continuous Data Data that has values that vary
continuously over an interval. Data that is
continuous and unbroken curves. Usually a
physical measurement, can increase/decrease in
minutely small values.
12
- Classify each set of data as discrete or
continuous. - 1) The number of suitcases lost by an airline.
- Discrete. The number of suitcases lost must be a
whole number. - 2) The height of corn plants.
- Continuous. The height of corn plants can take on
infinitely many values (any decimal is possible).
- 3) The number of ears of corn produced.
- Discrete. The number of ears of corn must be a
whole number.
13
Classify each set of data as discrete or
continuous.
- 4) The number of green MM's in a bag.
- Discrete. The number of green MM's must be a
whole number. - 5) The time it takes for a car battery to die.
- Continuous. The amount of time can take on
infinitely many values (any decimal is possible).
- 6) The production of tomatoes by weight.
- Continuous. The weight of the tomatoes can take
on infinitely many values (any decimal is
possible).
14
Homework
- Using functions and the analysis of Graphical
Information - P22 1 8, 10
Recommended
