Windows 2003 Event Viewer Logs - PowerPoint PPT Presentation
1 / 26
Title:
Windows 2003 Event Viewer Logs
Description:
Contains information about events generated by Windows 2003 components, such as ... Present data in a printable graph, histogram, or report view ... – PowerPoint PPT presentation
Number of Views:104
Avg rating:3.0/5.0
Title: Windows 2003 Event Viewer Logs
1
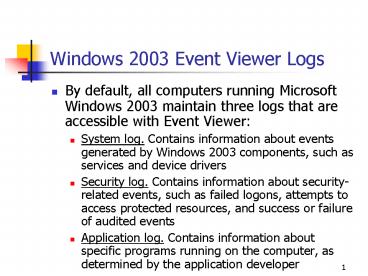
Windows 2003 Event Viewer Logs
- By default, all computers running Microsoft
Windows 2003 maintain three logs that are
accessible with Event Viewer - System log. Contains information about events
generated by Windows 2003 components, such as
services and device drivers - Security log. Contains information about
security-related events, such as failed logons,
attempts to access protected resources, and
success or failure of audited events - Application log. Contains information about
specific programs running on the computer, as
determined by the application developer
2
Windows 2003 Domain Controller Logs
- When you promote a computer running Microsoft
Windows 2003 Server to a domain controller, three
more logs are added to Event Viewer - Directory service log. Contains information about
the Active Directory service events - File replication service log. Contains
information about the success or failure of file
replication activities - DNS server log. Contains information about the
status and operations of the DNS service
3
The Windows 2003 Event Viewer Console
4
Windows 2003 Event Types
5
An Event Properties Dialog Box
6
The Event Viewer Filter Tab
7
The Windows 2003 Performance Console
8
System Monitor Tasks
- System Monitor enables you to perform the
following tasks - Collect and view real-time performance data on a
local computer or from remote computers - View data collected either currently or
previously in a counter log - Present data in a printable graph, histogram, or
report view - Automatically incorporate System Monitor
functionality into Microsoft Word or other
applications in the Microsoft Office suite - Create Hypertext Markup Language (HTML) pages
from performance views - Create reusable monitoring configurations that
can be installed on other computers that use the
Microsoft Management Console (MMC) console
9
System Monitor Charting
10
The Add Counters Dialog Box
11
Suggested System Monitoring Counters
- Cache\Data Map Hits
- Cache\Fast Reads/sec
- Cache\Lazy Write Pages/sec
- Logical Disk\ Disk Space
- Memory\Pages/sec
- Memory\Available Bytes
- Memory\Nonpaged Pool Allocs
- Memory\Nonpaged Pool Bytes
- Memory\Paged Pool Allocs
- Memory\Paged Pool Bytes
- PhysicalDisk\ Disk Time
- Processor(_Total)\ Processor Time
- System\Context Switches/sec
- System\Processor Queue Length
- Processor(_Total) \Interrupts/sec
12
Performance Logs And Alerts Tasks
- The Performance Logs And Alerts snap-in enables
you to perform the following tasks - Collect data in a comma-delimited or
tab-separated format for easy import to
spreadsheet programs - View counter data during collection and after
collection has stopped - Define start and stop times, file names, file
sizes, and other parameters for automatic log
generation - Manage multiple logging sessions from a single
console window - Set an alert on a counter, instructing the
console to send a message, run a program, or
start a log when the selected counter reaches a
specified value
13
Logs and Alerts in the Performance Logs And
Alerts Snap-In
14
The Shared Folders Snap-In
15
The Shares Folder in the Computer Management
Console
16
The Create Shared Folder Wizard
17
The Sessions Folder in the Shared Folders Snap-In
18
The Open Files Folder in the Shared Folders
Snap-In
19
The DHCP Consoles Server Statistics Dialog Box
20
DHCP Log File Fields
- ID. Contains a numeric code that identifies the
reason for the log entry - Date. Specifies the date that the log entry was
created - Time. Specifies the time that the log entry was
created - Description. Contains a description of the event
that triggered the log entry - IP Address. Contains the Internet Protocol (IP)
address of the Dynamic Host Configuration
Protocol (DHCP) client (if any) involved in the
logged event - Host Name. Contains the host name of the DHCP
client involved in the logged event - MAC Address. Contains the hardware address of the
DHCP client involved in the logged event
21
The WINS Server Statistics Dialog Box
22
The Logging Tab of a DNS Servers Properties
Dialog Box
23
The RRAS Consoles Server Status Display
24
The RRAS TCP/IP Information Window
25
The Capture Filter Dialog Box
26
The Display Filter Dialog Box


