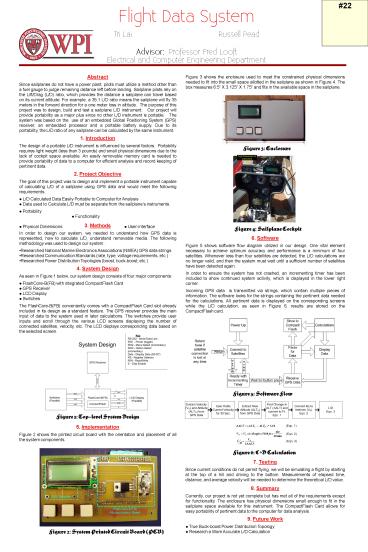
Flight Data System PowerPoint PPT Presentation
1 / 1
Title: Flight Data System
1
Flight Data System Tri Lai Russell
Pead Advisor Professor Fred Looft
Electrical and Computer Engineering Department
Abstract Since sailplanes do not have a power
plant, pilots must utilize a method other than a
fuel gauge to judge remaining distance left
before landing. Sailplane pilots rely on the
Lift/Drag (L/D) ratio, which provides the
distance a sailplane can travel based on its
current altitude. For example, a 351 L/D ratio
means the sailplane will fly 35 meters in the
forward direction for a one meter loss in
altitude. The purpose of this project was to
design, build and test a sailplane L/D
instrument. Our project will provide
portability as a major plus since no other L/D
instrument is portable. The system was based on
the use of an embedded Global Positioning System
(GPS) receiver, an embedded processor and a
portable battery supply. Due to its portability,
the L/D ratio of any sailplane can be calculated
by the same instrument. 1. Introduction The
design of a portable L/D instrument is influenced
by several factors. Portability requires light
weight (less than 3 pounds) and small physical
dimensions due to the lack of cockpit space
available. An easily removable memory card is
needed to provide portability of data to a
computer for efficient analysis and record
keeping of pertinent data. 2. Project
Objective The goal of this project was to design
and implement a portable instrument capable of
calculating L/D of a sailplane using GPS data and
would meet the following requirements ? L/D
Calculated Data Easily Portable to Computer for
Analysis ? Data used to Calculate L/D must be
separate from the sailplanes instruments. ?
Portability ? Functionality ? Physical
Dimensions ? User-interface
Figure 3 shows the enclosure used to meet the
constrained physical dimensions needed to fit
into the small space allotted in the sailplane as
shown in Figure 4. The box measures 6.5 X 3.125
X 1.75 and fits in the available space in the
sailplane.
Figure 3 Enclosure
- 3. Methods
- In order to design our system, we needed to
understand how GPS data is represented, how to
calculate L/D, understand removable media. The
following methodology was used to design our
system - Researched National Marine Electronics
Associations (NMEA) GPS data strings - Researched Communication Standards (rate, type,
voltage requirements, etc.) - Researched Power Distribution Topologies (boost,
buck-boost, etc.) - 4. System Design
- As seen in Figure 1 below, our system design
consists of four major components - ? FlashCore-B(FB) with integrated CompactFlash
Card - ? GPS Receiver
- ? LCD Display
- ? Switches
- The FlashCore-B(FB) conveniently comes with a
CompactFlash Card slot already included in its
design as a standard feature. The GPS receiver
provides the main input of data to the system
used in later calculations. The switches provide
user inputs and scroll through the various LCD
screens displaying the number of connected
satellites, velocity, etc. The LCD displays
corresponding data based on the selected screen.
Figure 4 Sailplane Cockpit
6. Software Figure 5 shows software flow diagram
utilized in our design. One vital element
necessary to achieve optimum accuracy and
performance is a minimum of four satellites.
Whenever less than four satellites are detected,
the L/D calculations are no longer valid, and
then the system must wait until a sufficient
number of satellites have been detected again.
In order to ensure the system has not crashed,
an incrementing timer has been included to show
continued system activity, which is displayed in
the lower right corner. Incoming GPS data is
transmitted via strings, which contain multiple
pieces of information. The software looks for the
strings containing the pertinent data needed for
the calculations. All pertinent data is displayed
on the corresponding screens while the L/D
calculation, as seen in Figure 6, results are
stored on the CompactFlash card.
Figure 5 Software Flow
Figure 1 Top-level System Design
5. Implementation Figure 2 shows the printed
circuit board with the orientation and placement
of all the system components.
Figure 6 L/D Calculation
7. Testing Since current conditions do not
permit flying, we will be simulating a flight by
starting at the top of a hill and driving to the
bottom. Measurements of elapsed time, distance,
and average velocity will be needed to determine
the theoretical L/D value.
8. Summary Currently, our project is not yet
complete but has met all of the requirements
except for functionality. The enclosure has
physical dimensions small enough to fit in the
sailplane space available for this instrument.
The CompactFlash Card allows for easy portability
of pertinent data to the computer for data
analysis. 9. Future Work ? True Buck-boost
Power Distribution Topology ? Research a More
Accurate L/D Calculation
Figure 2 System Printed Circuit Board (PCB)

