
The Power of Data Visualization: Transforming Data into Actionable Insights PowerPoint PPT Presentation
Title: The Power of Data Visualization: Transforming Data into Actionable Insights
1
The Power of Data Visualization Transforming
Data into Actionable Insights In a world driven
by data, making sense of vast amounts of
information is a challenge. This is where data
visualization services emerge as a game-changer.
It bridges the gap between raw data and
actionable insights by presenting complex
information in a visual, comprehensible, and
interactive format. Whether you're a business
leader, data analyst, or decision-maker,
leveraging data visualization can help you
uncover trends, patterns, and opportunities that
drive success.
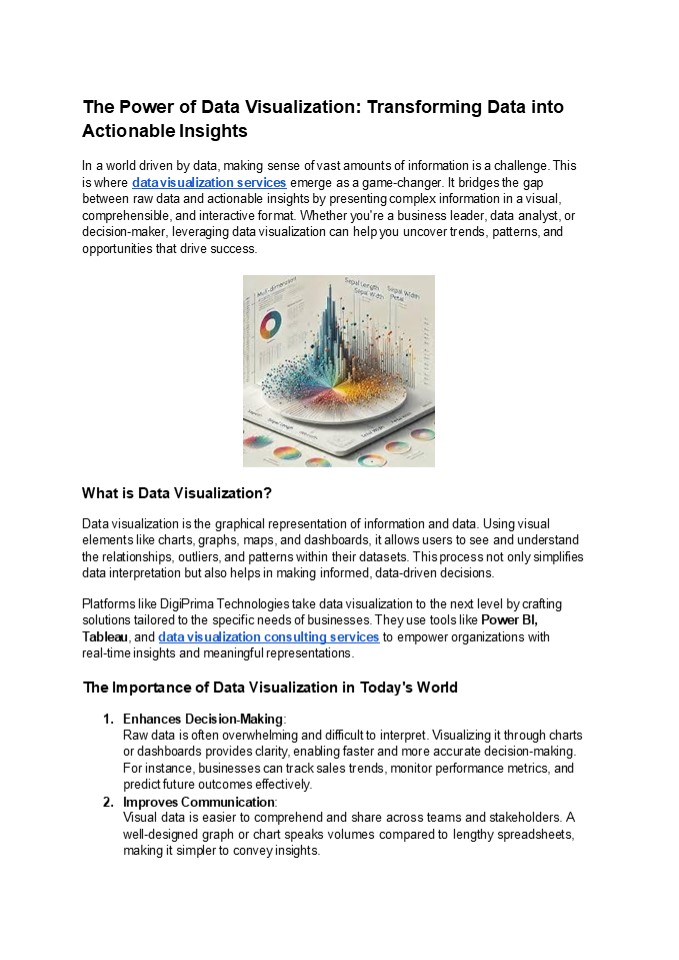
- What is Data Visualization?
- Data visualization is the graphical
representation of information and data. Using
visual elements like charts, graphs, maps, and
dashboards, it allows users to see and understand
the relationships, outliers, and patterns within
their datasets. This process not only simplifies
data interpretation but also helps in making
informed, data-driven decisions. - Platforms like DigiPrima Technologies take data
visualization to the next level by crafting
solutions tailored to the specific needs of
businesses. They use tools like Power BI,
Tableau, and data visualization consulting
services to empower organizations with real-time
insights and meaningful representations. - The Importance of Data Visualization in Today's
World - Enhances Decision-Making
- Raw data is often overwhelming and difficult to
interpret. Visualizing it through charts or
dashboards provides clarity, enabling faster and
more accurate decision-making. For instance,
businesses can track sales trends, monitor
performance metrics, and predict future outcomes
effectively. - Improves Communication
- Visual data is easier to comprehend and share
across teams and stakeholders. A well-designed
graph or chart speaks volumes compared to lengthy
spreadsheets, making it simpler to convey
insights.
2
- Reveals Hidden Trends
- Data visualization uncovers patterns and trends
that might be invisible in raw datasets. For
example, a sales heatmap can highlight
geographical regions with high demand, enabling
targeted marketing strategies. - Saves Time
- By summarizing vast amounts of data into visual
summaries, teams can save countless hours on
analysis and reporting, focusing instead on
strategy and execution. - Key Applications of Data Visualization
- Business Intelligence Modern enterprises use
customised dashboard data visualization tools to
monitor real-time KPIs, evaluate market trends,
and improve operational efficiency. Platforms
like Power BI integrate seamlessly into existing
systems, allowing organizations to harness
insights effortlessly. - Healthcare Analytics In healthcare,
visualizations help identify disease trends,
patient outcomes, and treatment effectiveness,
ensuring better care and resource allocation. - Financial Insights From tracking expenses to
forecasting revenue, data visualization enables
financial institutions to manage risks, assess
market trends, and optimize investments. - Supply Chain Management By mapping logistics and
inventory data, companies can identify
bottlenecks, reduce costs, and ensure smooth
operations. - Marketing and Sales Analysis Data visualization
empowers marketers with campaign insights,
customer behavior analysis, and ROI tracking.
Sales teams can pinpoint high-performing regions
or segments for better results. - DigiPrima's Role in Data Visualization
- DigiPrima Technologies specializes in delivering
custom data visualization solutions that align
with the unique requirements of its clients.
Their expertise spans multiple industries,
enabling businesses to achieve the following - Real-Time Dashboards Monitor performance metrics
in real-time to stay ahead of the competition. - Predictive Analytics Utilize machine
learning-powered visualizations to forecast
trends and market dynamics. - Interactive Visualizations Create dynamic
dashboards that allow users to interact and drill
down into data for deeper insights. - DigiPrima leverages cutting-edge tools like Power
BI, Tableau, and open-source platforms to deliver
tailored visualization services.
3
- Storytelling with Data Data storytelling
combines visuals with narratives, making
insights relatable and actionable. - Real-Time Data Visualization With IoT and big
data, real-time visualizations are increasingly
critical in industries like logistics and
healthcare. - Why Choose DigiPrima for Data Visualization?
- DigiPrima Technologies stands out as a trusted
partner for businesses seeking to transform raw
data into powerful insights. Heres why - Customized Solutions Tailored to fit the unique
needs of each organization. - Advanced Tools Expertise in platforms like Power
BI, Tableau, and cloud-based visualization. - Industry Experience Proven success across
healthcare, finance, manufacturing, and more. - Dedicated Support End-to-end support, from data
integration to implementation and training. - Conclusion
- In an era where data is the cornerstone of
success, effective data visualization can
revolutionize the way businesses operate. By
turning complex datasets into meaningful visuals,
organizations can make smarter decisions,
identify opportunities, and stay ahead of the
competition. - DigiPrima Technologies is your go-to partner for
harnessing the power of data visualization. With
their expertise, businesses can unlock actionable
insights, drive innovation, and achieve
measurable growth. - HAVE QUESTION?
- Call Us 1 (347) 9739732, 91-90399-28143
- Email Us inquiry_at_digiprima.com,
ashesh_at_digiprima.com Know More
https//www.digiprima.com/data-visualization
Recommended
