
Ensuring Accurate Interpretation of Waterfall Charts in Business Analysis PowerPoint PPT Presentation
Title: Ensuring Accurate Interpretation of Waterfall Charts in Business Analysis
1
Data Visualization Charts, Graphs and
Infographic designs Think Cell Q A Tutorial
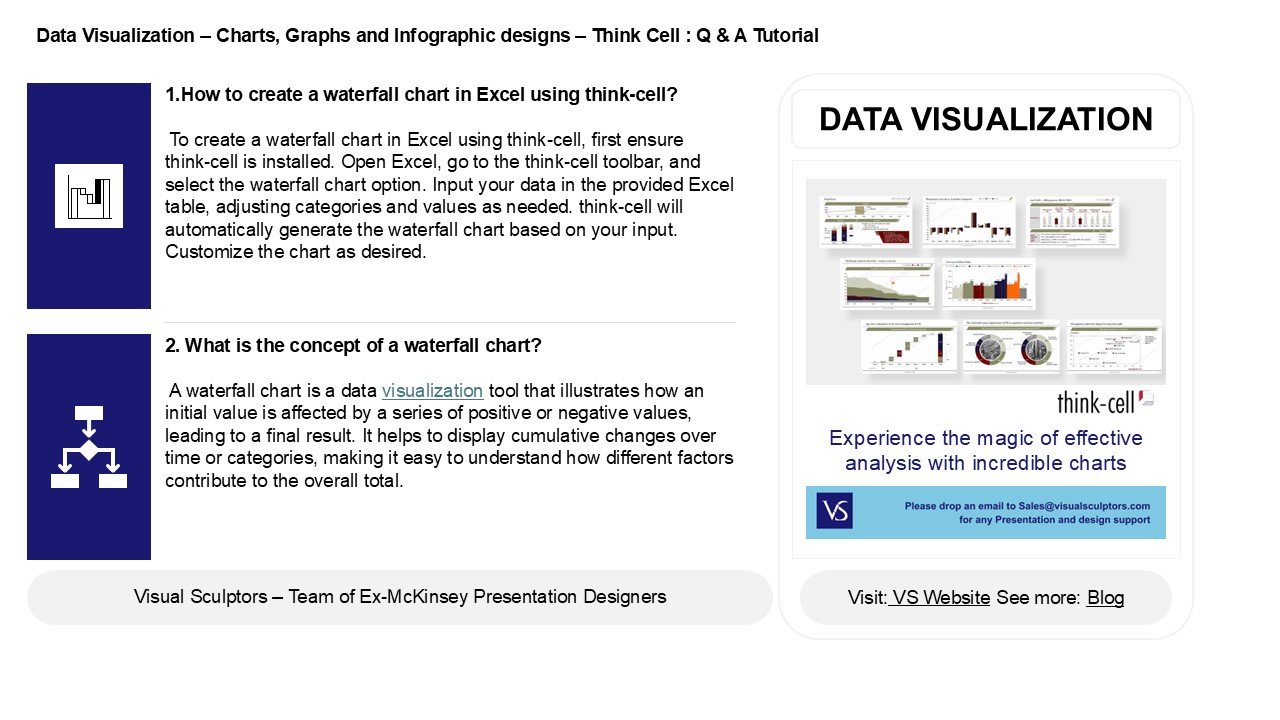
- 1.How to create a waterfall chart in Excel using
think-cell? - To create a waterfall chart in Excel using
think-cell, first ensure think-cell is installed.
Open Excel, go to the think-cell toolbar, and
select the waterfall chart option. Input your
data in the provided Excel table, adjusting
categories and values as needed. think-cell will
automatically generate the waterfall chart based
on your input. Customize the chart as desired.
DATA VISUALIZATION
2. What is the concept of a waterfall chart? A
waterfall chart is a data visualization tool that
illustrates how an initial value is affected by a
series of positive or negative values, leading to
a final result. It helps to display cumulative
changes over time or categories, making it easy
to understand how different factors contribute to
the overall total.
2
Data Visualization Charts, Graphs and
Infographic designs Think Cell Q A
Tutorial
3. How do you insert a waterfall chart? To
insert a waterfall chart in Excel, select your
data and go to the "Insert" tab. Click on
"Waterfall Chart" in the Charts group, and choose
"Waterfall" from the dropdown. Excel will
generate the chart based on your selected data.
You can then customize the chart as needed.
4. What are subtotals in think-cell waterfall
chart? Subtotals in a think-cell waterfall
chart represent intermediate values that
summarize a portion of the data before reaching
the final total. They help visualize the
contributions of different categories or stages
within the overall flow, making it easier to
analyze how individual elements influence the
final outcome. Subtotals enhance clarity and
understanding of the data's progression.
5. How to analyses a waterfall chart? To
analyze a waterfall chart, start by identifying
the starting value and follow the flow of
increases and decreases represented by bars. Each
segment shows the impact of specific categories
on the overall total. Look for trends,
significant contributions, and the final value to
understand how different elements influence the
overall change.
Recommended
