
Simplifying Task Management: The Benefits of Using think-cell for Gantt Charts PowerPoint PPT Presentation
Title: Simplifying Task Management: The Benefits of Using think-cell for Gantt Charts
1
Data Visualization Charts, Graphs and
Infographic designs Think Cell Expert QA
Guide
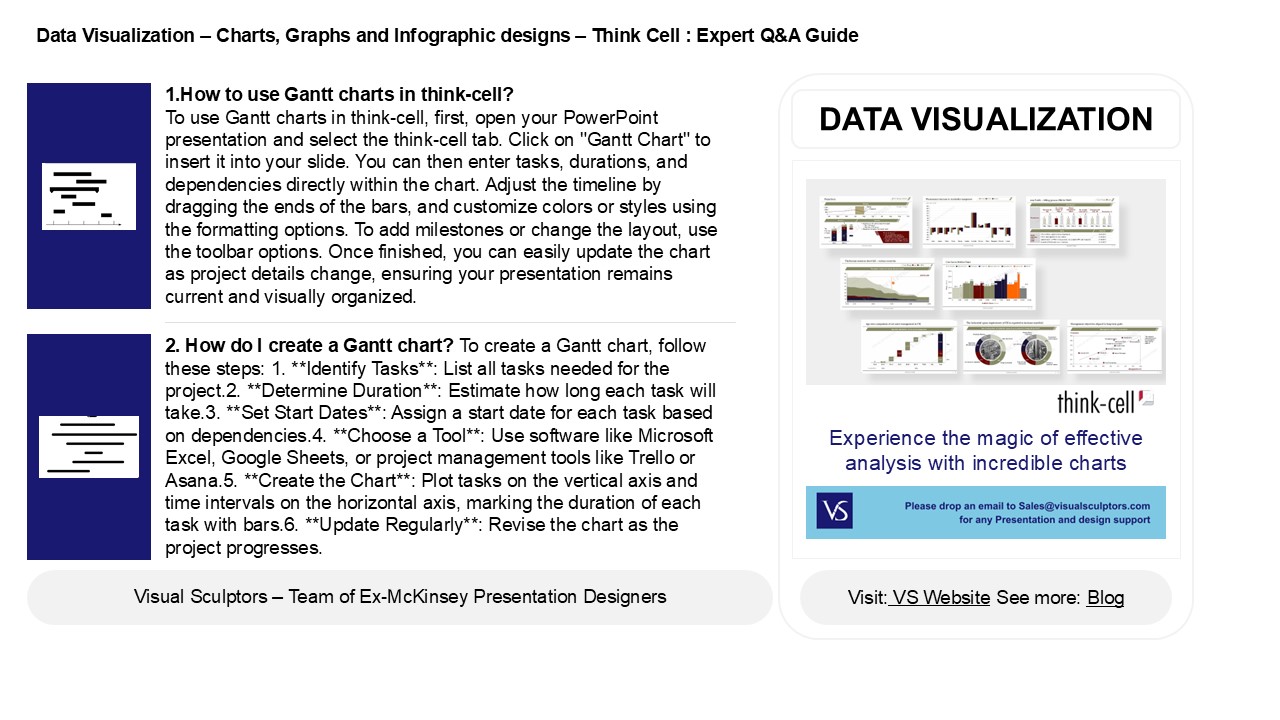
1.How to use Gantt charts in think-cell? To
use Gantt charts in think-cell, first, open your
PowerPoint presentation and select the think-cell
tab. Click on "Gantt Chart" to insert it into
your slide. You can then enter tasks, durations,
and dependencies directly within the chart.
Adjust the timeline by dragging the ends of the
bars, and customize colors or styles using the
formatting options. To add milestones or change
the layout, use the toolbar options. Once
finished, you can easily update the chart as
project details change, ensuring your
presentation remains current and visually
organized.
DATA VISUALIZATION
2. How do I create a Gantt chart? To create a
Gantt chart, follow these steps 1. Identify
Tasks List all tasks needed for the project.2.
Determine Duration Estimate how long each
task will take.3. Set Start Dates Assign a
start date for each task based on dependencies.4.
Choose a Tool Use software like Microsoft
Excel, Google Sheets, or project management tools
like Trello or Asana.5. Create the Chart
Plot tasks on the vertical axis and time
intervals on the horizontal axis, marking the
duration of each task with bars.6. Update
Regularly Revise the chart as the project
progresses.
2
Data Visualization Charts, Graphs and
Infographic designs Think Cell Expert QA
Guide
3. How do you modify the date range of a Gantt
chart think-cell? To modify the date range of a
Gantt chart in think-cell, click on the chart to
activate it. Then, locate the timeline at the top
of the chart. You can adjust the start and end
dates by dragging the edges of the timeline or by
clicking on the date fields and entering new
values directly. Additionally, you can
right-click on the timeline to access further
options for date adjustments. Remember to ensure
that tasks align correctly with the new date
range.
4. What is a Gantt chart example? A Gantt chart
is a visual project management tool that
illustrates a project schedule. For example, in a
software development project, tasks like
"Requirement Gathering" (Week 1-2), "Design
Phase" (Week 3-4), "Development" (Week 5-10), and
"Testing" (Week 11-12) can be represented as
horizontal bars along a timeline. Each bar's
length reflects the task's duration, allowing
teams to track progress, allocate resources, and
identify dependencies between tasks. Gantt charts
enhance clarity and help ensure timely project
completion.
5. What are the 3 uses of Gantt chart? Gantt
charts are used for project planning, scheduling,
and tracking progress. Firstly, they help
visualize the timeline of tasks and their
dependencies, making it easier to allocate
resources effectively. Secondly, they facilitate
communication among team members by providing a
clear overview of project status and deadlines.
Lastly, Gantt charts assist in monitoring
progress, allowing project managers to identify
delays or bottlenecks, enabling timely
adjustments to keep the project on track.
Recommended
