

Expost Impact Assessment at the World Agroforestry Centre PowerPoint PPT Presentation
1 / 10
Title: Expost Impact Assessment at the World Agroforestry Centre
1
Ex-post Impact Assessment at the World
Agroforestry Centre
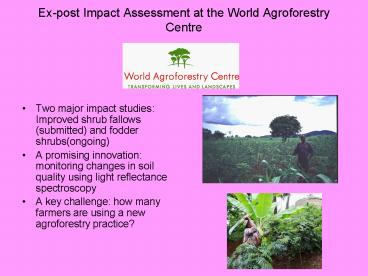
- Two major impact studies Improved shrub fallows
(submitted) and fodder shrubs(ongoing)? - A promising innovation monitoring changes in
soil quality using light reflectance spectroscopy - A key challenge how many farmers are using a new
agroforestry practice?
2
Improved fallows (Zambia and Kenya) and fodder
shrubs (East Africa)?
- Both involve
- Producing inputs (nitrogen for crops and protein
for milk production) instead of having to
purchase them - The attraction Both substitute small amounts of
labor and land for cash. - Farmer innovations have reduced labor and land
required even further - The returns
- Improved fallows returns to labor of 2.50/day
- Fodder shrubs 60 to 120 per year
3
Gender and planting of fodder shrubs in central
Kenya
- The good news
- 43 of planters were women
- But
- Female headed households
- plant fewer shrubs
- have lower shrub survival rates
- Why?
- - Extension approaches biased towards men
- - Women have more resource constraints
4
Pseudo-adoption the adoption of a practice not
for its intrinsic value in production but to
accrue benefits from organizations promoting the
practice
- Proportion of farmers planting improved fallows
who had received seeds from projects (n120),
Siaya and Vihiga Districts, Kenya (Kiptot et al.,
2007)?
Credit program
New project
Seed purchases
5
Innovative Impact Assessment Method Monitoring
Changes in Soil Quality (e.g. soil carbon, N, P,
CEC.)
Coupled with efficient ground sampling
techniques, it can be used with remote sensing
to interpolate results and generate soil
quality maps
- Light reflectance spectroscopy, a new tool for
rapid, accurate, and low cost diagnosis of soil
constraints. - Uses infra red light to detect minute differences
in composition and structure - Reduces the cost of soil analysis from 50/sample
to 0.5/sample
6
Nested, spatial sampling schemes
Block(s) sentinel site(s) 16 Clusters
(randomly placed, but spatially
stratified)? 10 Plots (randomly placed)?
minimize local biases that might arise from
convenience sampling
10 km
Example Konobougou Block, Segou
Walsh, Vagen, Shepherd (2006)?
7
Spatial distribution of soil physical degradation
risk in the Nyando River Basin Example of a
baseline
High risk area (1089.1 km-2)?
Estimated prevalence 39.5 52.9 Specific
risks sheet erosion, hard-setting, and gully
erosion
8
A key challenge Estimating numbers of farmers
planting fodder shrubs
- The problem
- Plantings are often in clusters so a farmer
survey across large areas would not give accurate
results. - The solution
- High density areas farmer surveys
- Low density areas Partner estimates based on
records and verification - Survey of 224 organizations promoting fodder
shrubs across 4 countries
9
(No Transcript)
10
- Other supporting evidence
- Seed vendors In central Kenya in 2006, 43 seed
vendors sold 1.1 tons, enough for 40,000 farmers
to plant. - Farmer to farmer dissemination The average
adopter gave seed to 6 other farmers over a three
year period following planting but 5 of the
farmers were responsible for 2/3 of the
dissemination
Recommended

