
Assimilation, organic production and release of carbon PowerPoint PPT Presentation
1 / 1
Title: Assimilation, organic production and release of carbon
1
Assimilation, organic production and release of
carbon
J.K. Egge1, H.P. Grossart2 , M. Allgaier2, A.
Engel3
1 Department of Biology, University of Bergen,
N-5020 Bergen, Norway 2 IGB-Neuglobsow, Dept.
Limnology of Stratified Lakes, Alte Fischerhuette
2, D-16775 Stechlin,, Germany 3 Alfred Wegener
Institute (AWI) for Marine and Polar Research, Am
Handelshafen 12,D - 27570 Bremerhaven, Germany
INTRODUCTION A 20 days long experiment was
carried out in Bergen May 2003 in order to
investigate effects of different CO2 levels on
seawater chemistry and the pelagic community. 9
transparent mesocosms covered by gas-tight tents
(95 light transmission) and with a volume of 27
m3 were used. Prior to the experiment the
seawater carbonate system in the mesocosms was
manipulated to achieve 3 different CO2 levels
corresponding to glacial (190 ppmV), present (370
ppmV) and year 2100 (700 ppmV). At onset of the
experiment nitrate, phosphate and silicate were
added (ratio 80.512 mmol L-1). In order to
favour diatom growth, the concentration of
silicate was kept relatively high. This poster
reports the bacteria- and primary production.
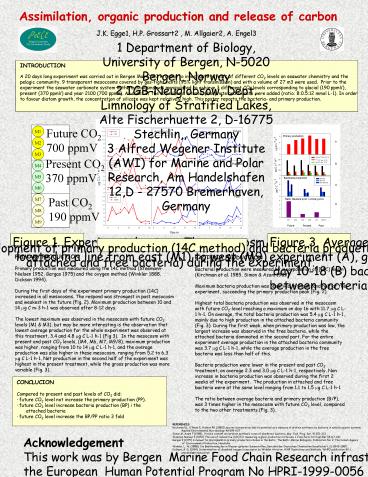
Figure 1. Experimental set-up. The mesocosm
located in a line from east (M1) to west (M9)
Figure 3. Average primary production (14C) for
the experiment (A), gross and net primary
production day 10-18 (B) bacteria production (C)
and the ratio between bacteria and primary
production (D).
Figure 2. Development of primary production (14C
method) and bacteria production (total, attached
and free bacteria) during the experiment.
PRIMARY PRODUCTION Primary production was
measured using the 14C method (Steemann-Nielsen
1952, Gargas 1975) and the oxygen method (Winkler
1888, Dickson 1994). During the first days of
the experiment primary production (14C) increased
in all mesocosms. The respond was strongest in
past mesocosm and weakest in the future (Fig. 2).
Maximum production between 10 and 14 ?g C m-3 h-1
was observed after 8-12 days. The lowest
maximum was observed in the mesocosm with future
CO2 levels (M1 M3), but may be more interesting
is the observation that lowest average production
for the whole experiment was observed at this
treatment, 3.4 and 4.8 ?g C L-1 h-1 (Fig 3). In
the mesocosm with present and past CO2 levels,
(M4, M6, M7, M9/8), maximum production was
higher, ranging from 10 to 14 ?g C L-1 h-1, and
the average production was also higher in these
mesocosm, ranging from 5.2 to 6.3 ?g C L-1 h-1.
Net production in the second half of the
experiment was highest in the present treatment,
while the gross production was more variable
(Fig. 3).
BACTERIA PRODUCTION Bacterial production were
measured by incorporation of 14C leucin
(Kirchman et al. 1985, Simon Azam
1989) Maximum bacteria production was observed
in the second half of the experiment, succeeding
the primary production peak (Fig. 2). Highest
total bacteria production was observed in the
mesocosm with future CO2-level reaching a maximum
on day 16 with 11.7 ?g C L-1 h-1. On average, the
total bacteria production was 5.4 ?g C L-1 h-1,
mainly due to high production in the attached
bacteria community (Fig. 3). During the first
week, when primary production was low, the
largest increase was observed in the free
bacteria, while the attached bacteria dominated
in the second part. For the entire experiment
average production in the attached bacteria
community was 3.7 ?g C L-1 h-1, while the average
production in the free bacteria was less than
half of this. Bacteria production were lower in
the present and past CO2 treatment, on average
2.3 and 3.0 ?g C L-1 h-1, respectively. Non
increase in bacteria production was observed
during the first 2 weeks of the experiment. The
production in attached and free bacteria were at
the same level ranging from 1.1 to 1.5 ?g C L-1
h-1 The ratio between average bacteria and
primary production (B/P), was 3 times higher in
the mesocosm with future CO2 level, compared to
the two other treatments (Fig. 3).
REFERENCES Kirchman DL, K'Nees E, Hodson RE
(1985) Leucine incorporation and its potential as
a measure of protein synthesis by bacteria in
natural aquatic systems. Applied Environmental
Microbiology 49599-607 Simon M, Azam F (1989).
Protein content and protein synthesis rates of
planktonic bacteria. Mar. Ecol. Prog. Ser.
51201-213 Steeman Nielsen E (1952) The use of
radioactive (14C) for measuring organic
production in the sea. J Cons Perm Int Expl Mer
18117-140 Gargas E (1975) A manual for
phytoplankton primary production studies in the
Baltic. The Baltic Marine Biologists, Publication
No. 2. The Danish Agency of Environmental
Protection, Hørsholm Winkler, L. W. (1888). Die
Bestimmung des in Wasser gelösten Sauerstoffes.
Berichte der Deutschen Chemischen Gesellschaft,
212843-2855. Dickson, A. G. (1994).
Determination of dissolved oxygen in sea water by
Winkler titration. WHP Operations and Methods.
WHPO publication 90-1, unpublished manuscript.
Acknowledgement This work was by Bergen Marine
Food Chain Research infrastructure (RI) , the
European Human Potential Program No
HPRI-1999-0056
Recommended
