
Table 5'01: Stock and Flow of Paediatric Renal Replacement Therapy 19972006 PowerPoint PPT Presentation
1 / 13
Title: Table 5'01: Stock and Flow of Paediatric Renal Replacement Therapy 19972006
1
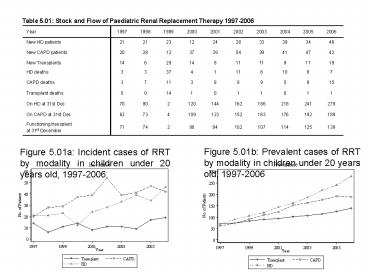
Table 5.01 Stock and Flow of Paediatric Renal
Replacement Therapy 1997-2006
Figure 5.01b Prevalent cases of RRT by modality
in children under 20 years old, 1997-2006
Figure 5.01a Incident cases of RRT by modality
in children under 20 years old, 1997-2006
2
Table 5.02 Paediatric Dialysis and Transplant
Rates per million age-group population 1997-2006
Figure 5.02 Incidence and prevalence rate per
million age related population years old on RRT,
1997-2006
3
Table 5.03a Dialysis Treatment Rate by State,
per million state age group population, 1997-2006
4
Table 5.03b New Dialysis Patients by State,
1997-2006
5
Figure 5.04 Number of New Dialysis and
Transplant Patients by gender 1997-2006
6
Figure 5.05 Dialysis and Transplant Treatment
Rate by Age group 1997-2006
7
Figure 5.06 New Dialysis by treatment modality
1997-2006
8
Figure 5.07 New Dialysis by sector 1997-2006
9
Table 5.08 Primary renal disease by sex,
1997-2006
10
Table 5.09 Types of Renal Transplant 1997-2006
11
Table 5.10 Patient Survival by Modality of RRT,
1997-2006
No. Number at risk SE Standard Error
Figure 5.10 Patient Survival by Modality of RRT,
1997-2006
12
Table 5.11 Dialysis Technique Survival by
Modality, 1997-2006
No. Number at risk SE Standard Error
Figure 5.11 Dialysis Technique Survival by
Modality, 1997-2006
13
Table 5.12 Transplant Graft Survival 1997-2006
No. Number at risk SE Standard Error
Figure 5.12 Transplant Graft Survival 1997-2006
Recommended
