
Obesity and Type 2 Diabetes PowerPoint PPT Presentation
1 / 62
Title: Obesity and Type 2 Diabetes
1
slow
dynamics
fast
Brain
high
Food
GI
Heart
Oxy
Control?
- Energy
- Inflammation
- Coagulation
Lac/ph
Glu
priority
Triglyc
Muscle
FFA
Out
Evolved for large energy variation and moderate
trauma
Glyc
low
Liver
Glycerol
Glyc
Fat
2
Purpose of these notes
- Prepare with Mike for Monday proposal talks for
BI panel - Help Ben and all think about first paper
- Focus on 1st order model fits for moderate
intensity - Focus on BP control model and order reduction
- Theme apparent high complexity and variability
in both time series and first principles model
largely goes away with rigorous tools for
dynamics and control and careful measurements - Next steps simple model fails to capture two
important features, well see how far we get but
these would be next papers - Oscillations at rest
- Fatigue at high intensity
- Help all think about next steps
- This week we start much more extensive
measurements - Extend fitting to multiple measurements
- Extend 1st principles model (more details later)
- Aim for both fit and mechanistic models for both
oscillations and fatigue
3
Brain
fast
Intense
high
Heart
Oxy
Lac/Ph
Glu
Muscle
Out
- Insulin resistance
- hoard sugar
- High intensity
- Brain
Glyc
Liver
low
Glyc
4
- Key ideas
- Glucose is essential for the brain and/or intense
activity - Other tissues/intensities are ok burning fat
- Insulin resistance (and fat accumulation) is a
robust control strategy in an environment of high
energy fluxes - It becomes a disease only when chronic and only
following years of inactivity
Intense
- Insulin resistance
- hoard sugar
- High intensity
- Brain
5
slow
dynamics
fast
Brain
high
Active
Heart/ lungs
Glu
priority
FFA
Muscle
Out
- Insulin resistance
- hoard sugar
- High intensity
- Brain
Glyc
low
Liver
Fat
6
slow
dynamics
fast
Brain
high
Active
Heart/ lungs
Glu
priority
FFA
Muscle
Out
- Insulin resistance
- hoard sugar
- High intensity
- Brain
Glyc
low
Liver
Fat
7
slow
dynamics
fast
Brain
high
Active
Heart/ lungs
Control?
Glu
priority
FFA
Muscle
Out
- Insulin resistance
- hoard sugar
- High intensity
- Brain
Glyc
low
Liver
Fat
8
slow
dynamics
fast
Brain
high
Active
Heart/ lungs
Control?
Glu
priority
FFA
Muscle
Out
- Insulin resistance
- hoard sugar
- High intensity
- Brain
Glyc
low
Liver
Fat
9
Brain
slow
Food
GI
Heart
Active Feeding
Active
Glu
Triglyc
Muscle
Insulin
Out
Glyc
Liver
Glyc
Fat
10
- Remarkable observations
- Exercise is nearly 100 effect in treating Type 2
- DJB surgery cures Type 2 immediately, even when
no weight loss results
11
Type 2
Brain
?Active
Glu
Muscle
Glyc
Liver
Fat
Glyc
12
Type 2
Brain
Food
GI
Heart
?GIP ?GLP-1
DJB
Glu
Triglyc
Muscle
Glyc
Liver
Fat
Glyc
Adipokines ?unchanged
13
Peripheral dynamics are likely to be bewildering
in isolation.
- Worked examples
- Bacteria
- Chemotaxis
- Heat shock
- Glycolytic oscillations
- Internet
- Aerospace
- Insulin resistance
- hoard sugar
- High intensity
- Brain
Fat
14
R-R Intervals ms
Oscillations as benign side-effects?
1000
Tight control
800
JP
600
KB
400
150 watts
0 watts
100 watts
200
0
3
4
1
2
Time(min)
Low variability at constant watts
15
Oscillations as benign side-effects?
- Example is well-known and heavily studied
oscillations yet of unknown cause - Pronounced in young and fit
- Conjecture Benign side effect at 0 watts of
robust control for high watt levels (cured by
loss of fitness, aging) - Conjecture Type 2 is chronic bad side effect at
0 watts of robust control for lifestyle with high
watt variations - Conjecture Chronic inflammation is bad side
effect at 0 watts of robust control for lifestyle
with high watt variations and mild trauma
16
slow
dynamics
fast
Diabetes as bad side-effects?
Brain
high
Active
Heart/ lungs
Control?
Glu
priority
FFA
Muscle
Out
- Insulin resistance
- hoard sugar
- High intensity
- Brain
Glyc
low
Liver
Fat
17
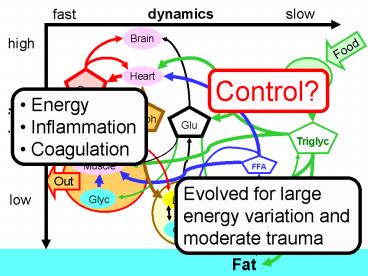
slow
dynamics
fast
Brain
high
Food
GI
Heart
Oxy
Control?
- Energy
- Inflammation
- Coagulation
Lac/ph
Glu
priority
Triglyc
Muscle
FFA
Out
Evolved for large energy variation and moderate
trauma
Glyc
low
Liver
Glycerol
Glyc
Fat
18
Details from first day
- Pfizer meeting at UCSB
19
Progress
- Data to models for multiple subjects
- Connections with first principles models
- Rigorous role of models and data
- Plans
- Expanding data and models
- Gases and fat/glucose/lactate control in
healthy/diseased - Leverage NIH funding and ICB collaborations
20
Background
- Hypothesis is that transient/acute
- Insulin resistance
- Fat accumulation
- Inflammation
- Is robust control strategy in healthy/active
- Disease (chronic) side effect of novel
environment - Strategy understand healthy/active control
- Goal direct therapies, context for cellular
strategies - Tools analysis of data and models
21
slow
dynamics
fast
Brain
high
Food
GI
Heart
Oxy
Lac/ph
Glu
priority
Triglyc
Muscle
FFA
Out
Glyc
low
Liver
Glycerol
Glyc
Fat
22
First principles model gases, substrates
Pulmonary peripheral Lungs, Fp , Rp
VE
arterial pulmonary
venous pulmonary
Qr
Ql
H
right heart Rr , Sr
left heart, Rl , Sl
Feedback Controller
arterial systemic
venous systemic
Related States
systemic peripheral, Tissues, Fs
Workload,w(t)
23
First principles model
Pulmonary peripheral Lungs, Fp , Rp
VE
arterial pulmonary
venous pulmonary
Qr
Ql
H
right heart Rr , Sr
left heart, Rl , Sl
Feedback Controller
arterial systemic
venous systemic
Related States
systemic peripheral, Tissues, Fs
Workload,w(t)
24
Data
- Challenges
- Global analysis
- Identifying missing mechanisms
- Identify optimal experiments
Detailed models
25
Typical data set
1st order, linear model
300
160
HR data
watts
250
140
200
watts
150
HR
120
100
100
HR model
50
80
0
0
10
20
30
40
50
60
70
80
time(min)
26
160
HR data
140
HR
120
100
80
0
10
20
30
40
50
60
70
80
time(min)
27
300
watts
250
200
watts
150
100
50
0
0
10
20
30
40
50
60
70
80
time(min)
28
300
160
HR data
watts
250
140
200
watts
150
HR
120
100
100
50
80
0
0
10
20
30
40
50
60
70
80
time(min)
29
HR
linear dynamics
1st order
30
1st order, linear model
300
160
HR data
watts
250
140
200
watts
150
HR
120
100
100
HR model
50
80
0
0
10
20
30
40
50
60
70
80
time(min)
31
First principles model
Pulmonary peripheral Lungs, Fp , Rp
VE
arterial pulmonary
venous pulmonary
Qr
Ql
H
right heart Rr , Sr
left heart, Rl , Sl
Feedback Controller
arterial systemic
venous systemic
Related States
systemic peripheral, Tissues, Fs
Workload,w(t)
32
9 state BP control model
Pulmonary peripheral Lungs, Fp , Rp
arterial pulmonary
venous pulmonary
Qr
Ql
H
Feedback Controller
right heart Rr , Sr
left heart, Rl , Sl
arterial systemic
venous systemic
systemic peripheral, Tissues, Fs
Workload,w(t)
33
Pulmonary peripheral Lungs, Fp , Rp
9 state BP control model
arterial pulmonary
venous pulmonary
Qr
Ql
H
Feedback Controller
right heart Rr , Sr
left heart, Rl , Sl
arterial systemic
venous systemic
systemic peripheral, Tissues, Fs
Workload,w(t)
- Start with standard literature model (9 states)
- Details of plumbing modeled explicitly
- Neuro-endocrine control modeled as optimal LQ
controller - Closed loop system ? linear and 1st order
- Comparable with best fit linear 1st order
model - Cannot capture fatigue (must add additional
mechanisms)
34
9 state BP control model
35
170
linear models 1st order
HR data
160
150
140
130
HR
120
110
100
90
9th order
80
70
0
10
20
30
40
50
60
70
80
time(min)
36
170
linear models 1st order
160
HR data
150
140
130
HR
120
110
9th order
100
90
Optimal fit model
80
70
0
10
20
30
40
50
60
70
80
time(min)
37
Pulmonary peripheral Lungs, Fp , Rp
9 state BP control model
arterial pulmonary
venous pulmonary
Qr
Ql
H
Feedback Controller
right heart Rr , Sr
left heart, Rl , Sl
arterial systemic
venous systemic
systemic peripheral, Tissues, Fs
Workload,w(t)
- Start with standard literature model (9 states)
- Details of plumbing modeled explicitly
- Neuro-endocrine control modeled as optimal LQ
controller - Closed loop system ? linear and 1st order
- Comparable with best fit linear 1st order
model - Cannot capture fatigue (must add additional
mechanisms)
38
- Closed loop system ? linear and 1st order
- Most parameters and states minimally effect
closed loop behavior (for healthy/fit) - Cannot capture fatigue (must add additional
mechanisms) - What about oscillations?
39
1st order, nonlinear
40
Key idea
- Because we are using global methods
- We know there is no 1 state model of this form
- (And because this form is canonical)
- We must use more dynamic states to get a better
fit (not some other parameter values) - A 2nd order model fits extremely well!
41
2nd order, nonlinear
fatigue
42
nonlinear forcing
HR
linear dynamics
1st order
2nd order
Fatigue
43
1st order, nonlinear
2nd order, nonlinear
fatigue
44
Key idea
- The difference between 1st and 2nd order is even
more dramatic for more intense efforts - Next we look at the same subject but during a
harder exercise - The 2nd state seems to abstractly capture what
fatigue is, as the subject must slow down when
the state gets large - Fatigue is a poorly understood process which this
work will hopefully clarify.
45
(No Transcript)
46
fatigue
47
170
1st order, nonlinear
160
2nd order, nonlinear
150
140
130
HR
120
110
100
90
80
fatigue
70
0
10
20
30
40
50
60
70
80
time(min)
48
170
2nd order
1st order
160
150
140
130
HR
120
110
100
90
80
70
0
10
20
30
40
50
60
70
80
time(min)
49
1st order
2nd order
170
160
150
140
130
HR
120
110
100
90
fatigue
80
70
40
50
time(min)
50
- Extra dynamics HR time series largely explainable
by one extra fatigue state - Thus most of HR variability due to activity
variability - Key idea This greatly compresses the time series
data into a simple model - We can focus on explaining this model and
temporarily ignore the data - Does this work for other subjects with different
parameters?
HR
nonlinear forcing
linear dynamics
Fatigue
51
Same structure new subject and parameters
nonlinear forcing
HR
linear dynamics
1st order
2nd order
Fatigue
52
Feb 18, 1st order, linear
220
KB
250
210
200
200
190
180
150
watts
HR
170
160
100
150
50
140
130
0
120
0
10
20
30
40
50
60
time(min)
53
Feb 18, 2nd order, linear
2nd order, linear
200
180
HR
160
140
fatigue
120
0
10
20
30
40
50
60
time(min)
54
Feb 18, 2nd order, linear
200
180
HR
160
140
fatigue
120
slowing
0
10
20
30
40
50
60
stopping
time(min)
55
Explaining fatigue?
- Add additional model and control complexity
(ventilation, gases, local metabolism) and see
what happens to linear dynamics at higher watt
levels. - Model reduce to get low order models for new
measurements (gases, ventilation, - Add saturation nonlinearities to see if this
gives additional insights. - Can we parameterize differences between fit and
unfit subjects to get clues about mechanism?
56
Oscillations?
2nd order
170
160
150
140
130
HR
120
110
100
90
fatigue
80
70
40
50
time(min)
57
2nd order
170
160
300
150
250
140
200
130
watts
HR
120
150
110
100
100
50
90
fatigue
80
0
70
40
50
time(min)
58
Oscillations
Bike controller
170
160
300
150
250
watts
140
CV control
200
130
watts
HR
model
120
150
110
100
100
fatigue
50
90
80
0
70
time(min)
Model does not capture these dynamics. Are they
real?
59
Oscillations
Bikemuscle control
170
160
300
150
250
140
CV control
200
130
watts
HR
120
150
110
100
100
50
90
80
0
70
3 min
60
Key idea
- These oscillations are not captured by the model
- The oscillations in watts are side-effects of the
robust electromechanical control system of the
exercise machine (a well-known property of
engineering control systems) - Conjecture The oscillations in heart rate are
benign side effects at 0 watts of robust control
for higher watt levels. - Both are completely (and rigorously) unrelated to
edge of chaos
61
R-R Intervals ms
Oscillations as benign side-effects?
1000
Tight control
800
JP
600
KB
400
150 watts
0 watts
100 watts
200
0
3
4
1
2
Time(min)
Low variability at constant watts
62
Explaining oscillations?
- First try take BP model, design controller at,
say, 100 watts, and then shift parameters to rest
but keep the same controller. Can we get
oscillatory poles due to change (stiffening) of
peripheral resistance? - If not add additional model and control
complexity (ventilation, gases, local metabolism)
and repeat, shifting from 100 watts to rest but
keeping the controller fixed. - Can we parametrize differences between fit and
unfit subjects to get clues about mechanism?
Recommended
