
Four major statistical categories - PowerPoint PPT Presentation
1 / 40
Title:
Four major statistical categories
Description:
... which of five colours (silver, white, black, red, blue) they prefer in a car. ... Among a sales team of 24 staff, the actual numbers in the three categories turn ... – PowerPoint PPT presentation
Number of Views:46
Avg rating:3.0/5.0
Title: Four major statistical categories
1
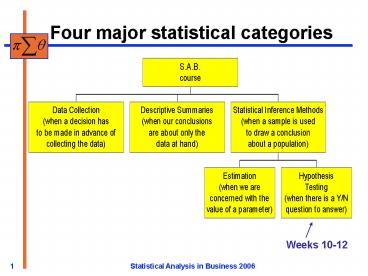
Four major statistical categories
Weeks 10-12
2
When to use a hypothesis test?
- Whenever
- a sample is used to represent a population,
- and
- the question to be investigated is about a
parameter (or parameters), and has a yes/no
answer.
3
Week 11 objectives
- 1. Chi-squared tests for categorical data
general form - 2. Tests of several proportions against a fixed
pattern goodness-of-fit tests - 3. The chi-squared distribution
- 4. Tests in two way contingency tables
- 5. Assumptions and Conditions
- 6. Standardised residuals
4
When is a goodness-of-fit test needed?
- In a national survey, consumers were asked the
question, In general, how would you rate the
level of service that businesses provide? - The response categories were excellent, pretty
good, only fair and poor. - A store manager wants to find out whether the
results of this national survey apply to
supermarket customers in her city. - She interviews randomly selected consumers as
they leave supermarkets in various parts of the
city. - Are observed responses consistent with those
expected on the basis of the national survey?
5
When is a chi-squared test in a contingency table
needed?
- Do men and women prefer the same colours of cars?
- Suppose a study is undertaken to address this
question. - A random sample of men and women are asked which
of five colours (silver, white, black, red, blue)
they prefer in a car. - The results are summarised in a contingency
table. - Is colour preference for cars independent of
gender?
6
Multi-parameter tests
- When a test involves several parameters, the
confidence interval method cannot be used - The test statistic must be some composite
quantity - In testing proportions, what is the test
statistic when several proportions are being
tested?
7
1. Goodness-of-fit tests for categorical data
The general form of Pearson's chi-squared goodness
-of-fit test statistic is where O is an
observed count and E is the corresponding
expected count, in various categories S
stands for summation over all the categories, and
Q denotes quadratic.
,
8
2. Example a test of several proportions against
a fixed pattern
- According to standard genetic theory,
- if the sex of new born babies is determined at
random with probabilities 1/2, 1/2 for males and
females, - then among families having two children, the
proportions of occurrences of 0, 1 or 2 females
should be 1/4, 1/2, 1/4 respectively. - Among a sample of 28 families, the counts in
these categories were 8, 11, 9 respectively. - The null hypothesis is the statement that the
population proportions should be 1/4, 1/2, 1/4
for the three categories respectively.
9
Goodness-of-fit test (continued)
10
Goodness-of-fit test (continued)
- The value of the goodness-of-fit test statistic
is 1.357 - What is the meaning of this?
- Is the fit to the theoretical proportions
1/41/21/4 a good fit or a poor fit? - What is the null distribution of the test
statistic? - The null distribution is chi-squared
11
3. What are chi-squared distributions?
- Like t-distributions, every chi-squared
distribution depends on a degrees of freedom
parameter - The mean value of a chi-squared variable is equal
to its degrees of freedom - Variables having chi-squared distributions are
always non-negative, and are usually quadratic,
ie sum of squares expressions, like sample
variances or goodness-of-fit statistics
12
(No Transcript)
13
Finding degrees of freedom and P-value
- The degrees of freedom is k?1, where k is the
number of proportions - If Ho is not true, the (O-E)-squared terms
inflate the goodness-of-fit criterion - So the P-value has the form
- Prchi-squared variable gt observed value
- Minitab will evaluate the P-value
14
Using Minitab to find the P-value
We have k 3 categories (ie 0, 1 or 2
females),so there are k?1 2 degrees of
freedom.
Therefore the P-value will not be small. In
Minitab use Calc gt Probability distributions gt
Chi-square, then select degrees of freedom 2,
Cumulative probability option, and input
constant 1.357. Chi-Square with 2 DF
x P( X lt x) 1.3570 0.4926 The
P-value is 1 0.49 0.51.
15
Solution using the six steps
16
The six steps (contd)
- (iv) The P-value is 0.51
- Decision rule Reject the null hypothesis if
P-value lt 0.05, but if P -value gt 0.05, then the
null hypothesis cannot be rejected. - In this case P-value 0.51, which is gt 0.05, so
the null hypothesis cannot be rejected. - (vi) Conclusion there is no evidence to suggest
that the underlying population proportions of
numbers of male and female children differ from
the pattern 1/41/21/4.
17
Further comments
- The case k 2 this can be tested with
- a 2 sample proportion test, using Minitab or
- the confidence interval method, or
- by a chi-squared goodness-of-fit test.
- The three methods give identical results
- Using Minitab to carry out goodness-of-fit tests
of proportions against a fixed pattern see
textbook for details
18
Lecture exercise 1
- A large company engages management consultants
who claim that for employees within the company,
the probabilities are - 1/3 for exceeding a set performance target,
- 1/3 for meeting the target exactly, and
- 1/3 for being below target.
- Among a sales team of 24 staff, the actual
numbers in the three categories turn out to be 6,
14 and 4. - Is there evidence that the basis of the
consultants predictions were wrong? Do steps 1
2.
19
Solution using the six steps
(i)
(ii)
20
Calculation details
21
The six steps (cont.)
- (iii) Assumptions and conditions see later
- The P-value is about 0.030, that is found from
the Minitab output below. - Chi-Square with 2 DF
- P( X lt x) x 0.9000
4.6052 - 0.9500 5.9915
- 0.9750 7.3778
- 0.9900 9.2103
22
The six steps (cont.)
- Decision rule reject the null hypothesis if
P-value lt 0.05, but if P-value gt 0.05, then the
null hypothesis cannot be rejected. - In this case P-value 0.03 lt 0.05, so the null
hypothesis is rejected. - (vi) Conclusion there is evidence to conclude
that the basis of the consultants predictions
were wrong.
23
4. Chi-squared tests in two way contingency tables
A survey of clients' satisfaction levels with the
facilities and management of three sporting
facilities is based on random samples of 20
clients in each facility. The results are
summarized in the following contingency table
Is there evidence of different satisfaction
levels in the three facilities?
24
Chi-squared test of independence
- A more common chi-squared test is when patterns
of row counts are compared for different columns
(or column counts in different rows). - In the example are the columns different?
- That is, we test for whether the row-variable
influenced the column-variable, or vice versa - This is called a test of independence of row and
column classifications
25
Contingency table tests (cont.)
26
Using Minitab for contingency table tests
27
Minitab output
28
Solution using the six steps
29
The six steps (cont.)
- (iii) Assumptions and conditions discussed
shortly - (iv) The P-value is 0.33
- Decision rule reject the null hypothesis if
P-value lt 0.05, but if P-value gt 0.05, then the
null hypothesis cannot be rejected. Here, since
P-value 0.33 gt 0.05, we cannot reject the null
hypothesis - (vi) Conclusion there is not enough statistical
evidence to suggest any differences in
satisfaction levels between the three sporting
facilities
30
5. Assumptions and conditions for all chi-squared
tests
- Well-defined categorical variables
- Representative sample
- Stable population proportions
- Independence
- Large number condition all expected values
should be gt 5
31
Assumptions and conditions in the sporting
facility example
- Well-defined categorical variables?
- Yes, either satisfaction or sporting
facility - Representative sample?
- OK from random sampling
- Stable population proportions?
- It would be OK if the survey is done quickly
- Independence?
- It would be OK if views are gathered in private
- Large number condition from Minitab output all E
values are either 14.67 or 5.33, both gt 5
32
What if the large number condition fails?
- Isolated E values which are lt 5 may be forgiven,
especially if only just lt 5 - But a large group of E values which are lt 5 may
indicate that the large number condition fails - Remedial action may be possible
- pool together some rows, or some columns. The E
values will increase. - Alternatively, simply delete some rows or some
columns. - Either way there will be a loss of degrees of
freedom. - Try to amalgamate similar rows/columns, so that
any new combined category has some meaning
33
6. Standardised residuals
34
More on standardised residuals
35
Another example of standardized residuals
36
Lecture exercise 2
- Following large payouts to directors, a company
surveys randomly selected stockholders about
their opinions of the companys public relations
image, and their size of shareholding. - Opinions were noted favourable, neutral or
unfavourable, - Size was categorized as small, medium or
large. - Does the size of shareholding influence the
opinion of the public relations image?
37
Data for lecture exercise 2
Does there seem to be an association between the
variables?
38
Which cells are influential in the final result?
Using Minitab output, complete the solution using
the six steps, including checking Conditions.
Answer
39
Steps (i), (ii)
40
Steps (iii) to (vi)
Recommended
CrystalGraphics Presentations


