
Server-based Approach to Web Visualization of Integrated 3-D Medical Image Data PowerPoint PPT Presentation
1 / 1
Title: Server-based Approach to Web Visualization of Integrated 3-D Medical Image Data
1
Server-based Approach to Web Visualization of
Integrated 3-D Medical Image Data
529.1
Andrew V. Poliakov, PhD1, Evan Albright, M.S1,
David P. Corina, PhD2, George Ojemann, M.D.3,
Richard F. Martin, PhD1,4, James F. Brinkley, MD,
PhD1 1Structural Informatics Group, Department
of Biological Structure, 2Department of
Psychology, 3Department of Neurological Surgery,
University of Washington, 4Washington Regional
Primate Research Center, Seattle, Washington USA
Server-side The graphics server utilizes
Skandha4 -- a general-purpose in-house graphics
toolkit. It combines a subset of Common Lisp --
useful for fast interactive programming and
prototyping -- with the ability to add
pre-compiled C-based primitive functions that
significantly accelerate computationally
demanding routines. Skandha4 supports 3-D
graphics, with drivers for IRIX GL and OpenGL
available. Modular Skandha4 implements
modular design, i.e. it allows developing plug-in
modules that may be included or excluded during
compilation. We have developed modules for
processing MRI data, importing/exporting various
file formats (GE, MINC, ANALYZE 7.5 ). Server
mode In addition to standalone mode, Skandha4
is designed to operate in server mode. It
implements a pre-forking server model, i.e. upon
initializing and (optionally) loading data and/or
code from a specified file, it forks several
child processes in advance, so that each of them
can handle a new connection from a client. A
connecting client needs to implement a simple
ASCII networking protocol to access all the
functionality of the server -- it can load data,
perform computational tasks, render 3-D scenes
etc. When the client disconnects, the child
process terminates, and the parent process forks
a new child, which will serve a new connection
from another client. Off-screen rendering
In server mode, scene rendering is typically
performed in off-screen mode. This functionality
is provided by Mesa graphics library an
implementation of OpenGL.
Abstract We describe web interfaces that
provide easy access to software tools we have
been developing for functional brain map data
related to language organization. We utilize an
application service provider approach all
computationally demanding tasks, including
rendering of 3-D scenes, are done by a high
performance graphics server in our central
computer facility. A web user visualizes and
analyzes the data using client-side applications
that send commands to the server to load and
process patient data, render a 3-D scene, and
receive back results and 2-D images. The
graphics server is implemented in our Skandha4
imaging and graphics toolkit, which can be used
to generate both standalone and server-based
applications. For language mapping, Skandha4
functions were developed to visualize and analyze
individual and population-based patient data, and
to integrate structural and functional MRI,
surgical stimulation sites, and 3-D models of the
cortical surface, veins and arteries. One client
application, for individual patient data, is
implemented as a Java applet. Another
application, for multiple patient data, is a
forms-based CGI interface that is used to study
stimulation sites after transformation into a
common Talairach space. The server-based
approach has allowed collaborators to use our
tools without the need to install specialized
software, or to upload and process large volumes
of data on the user workstations. The techniques
are applicable to multiple domains where
visualization and analysis of large imaging
datasets is of interest. Support Human Brain
Project grant DC02310 Equipment grant from Intel
Co.
Forms-based web interfaces
Experiment Management System3
Integrating stimulation sites from multiple
patients in Talairach space
Functional MRI Calculator Accessing large
datasets for multiple patients
Background As part of the Human Brain Project
we are developing software tools for processing,
integrating and visualizing multimodality data
for language mapping. Prior to surgery for
intractable epilepsy, structural (MRI, MRV, MRA)
and functional magnetic resonance (fMRI) images
are collected. The structural MRI images provide
an anatomical substrate on which to map
functional data. During surgery Cortical
Stimulation Mapping (CSM) is used to locate areas
of language on the cortex that need to be
avoided1. The epilepsy cases present a unique
opportunity because the CSM data provide a gold
standard against which the fMRI and other
non-invasive methods can be compared. The
image-based and neurosurgical data are integrated
within a structural information framework with
the aid of our Visual Brain Mapper, a tool for
reconstructing 3-D anatomical models and mapping
CSM sites onto those models, and our Experiment
Management System, for accessing the data over
the web.
- Problem
- We want to make the integrated 3-D data
accessible outside our lab - Visualizing 3-D medical imaging data is
challenging - Large amount (structural MRI , multiple
functional MRI volumes, 3D models) - Computationally demanding to render
- Client-side 3-D software is not adequate
- VRML, Java 3D
- Not yet widely standardized
- Slow for large datasets
- Typically limited to simpler techniques (slice
viewers, pre-computed images and movies)
- Rationale for server-side approach
- Network bandwidth limited
- Client-side rendering immature
- Server side offers a working solution
- Web interface accessible for anyone
- Other benefits -- Patient confidentiality
- Generalization to other applications
- Teleradiology
- Treatment planning
- Experiment management
- Online medical record
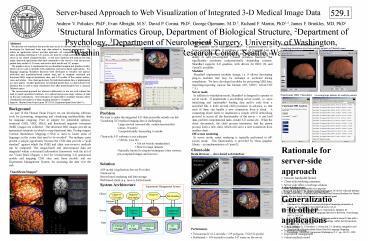
Client-side Brain Browser -- Java-based web
interface
Solution ASP model (Application Service
Provider) Client-server Server-based rendering
and data storage Web-based client (e.g. Java or
forms-based)
Visual Brain Mapper2
System Architecture
Experiment Management System
Acknowledgements This work was funded by Human
Brain Project grant DC02310, National Institute
of Deafness and Other Communication Disorders and
National Institute for Mental Health. We also
thank Intel for a generous equipment grant.
Client
Web Interface
Client 1 CGI script
Client 2 Java Applet
Client 3 . . .
- References
- Ojemann GA. Mapping of neuropsychological
language parameters at surgery. Int Anesthesiol
Clin 1986 Fall24(3)115-31 - Modayur BR, Prothero J, Ojemann, G, Maravilla K,
Brinkley JF. Visualization-based mapping of
language function in the brain. Neuroimage, 1997
6 245-258. - R. M. Jakobovits and J. F. Brinkley, Managing
medical research data with a Web-interfacing
repository manager, Proceedings, AMIA Fall
Symposium, Nashville, pp. 454-458, 1997. - A. V. Poliakov, K. P. Hinshaw, C. Rosse and J. F.
Brinkley, Integration and Visualization of
Multimodality Brain Data for Language Mapping,
Proceedings, AMIAFall Symposium Washington, D.C.,
pp. 349-53, 1999.
Internet
Graphics Server
snapshot
Server
snapshot
Relational Database
Data
- Performance
- Turn-around 10-12 seconds (106 polygons,
512x512 pixels) - Bottleneck -- 6-8 seconds to render 3-D scene on
the server
Stimulation Sites
3-D Models
3-D Image Volumes
2-D Images
Recommended
