
Real Time RTPCR qPCR PowerPoint PPT Presentation
1 / 10
Title: Real Time RTPCR qPCR
1
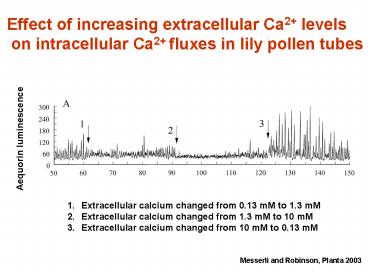
Effect of increasing extracellular Ca2 levels
on intracellular Ca2 fluxes in lily pollen tubes
Aequorin luminescence
- Extracellular calcium changed from 0.13 mM to 1.3
mM - Extracellular calcium changed from 1.3 mM to 10
mM - Extracellular calcium changed from 10 mM to 0.13
mM
Messerli and Robinson, Planta 2003
2
Quantitative Real Time RT-PCR (qPCR)
- Use of fluorescence in PCR reactions to monitor
the production of target at each step - Applications for
- Comparing relative changes in RNA levels
(treatment conditions, mutants or time) - Calculating RNA copy number
- Single nucleotide polymorphism detection
3
The Lux (Light Upon eXtension) effect
4
Cycle Threshold (Ct)
- The cycle threshold is the cycle at which the
measured fluorescence (and therefore product)
reaches a certain level - As starting template increases, the Ct decreases
5
Steps for Starting qPCR
- Choose and test control genes
- Experimentally determine optimal primer
concentrations - Compare amplification efficiencies
- Run experiment
- For new genes, compare efficiencies
6
Control Gene Requirements
- Constant expression levels over experimental
conditions (time or treatments) - i. e. housekeeping genes
- Similar amplification efficiencies to
experimental gene - For Arabidopsis used adenosine phosphoribosyltrans
ferase 1
7
Quantitative Real-time PCR analysis of Annexin
T-DNA insertion lines
Relative Expression
WT
WT
WT
WT
WT
WT
AnnAt 6-2
AnnAt 6-1
AnnAt 5-1
AnnAt 5-2
AnnAt 1-1
AnnAt 1-3
AnnAt 2-2
AnnAt 2-1
AnnAt 3-1
AnnAt 3-2
AnnAt 1-2
Flowers
AnnAt 4-2
AnnAt 4-1
8
Quantitative Real-time PCR analysis of Annexin
T-DNA insertion lines
Relative Expression
WT
WT
WT
WT
WT
WT
7-day old seedlings
AnnAt 1-2
AnnAt 1-1
AnnAt 3-1
AnnAt 3-2
AnnAt 6-2
AnnAt 6-1
AnnAt 5-2
AnnAt 7-1
AnnAt 8-1
9
Quantitative Real-time PCR analysis of AnnAt7
T-DNA insertion line
Relative Expression
AnnAt 7-2
WT
10
Quantitative Real-time PCR analysis of AnnAt8
T-DNA insertion line
Relative Expression
WT
AnnAt 8-2
Recommended
