
Water Storage in a till catchment: The Grdsjn Roof Experiment
1 / 31
Title:
Water Storage in a till catchment: The Grdsjn Roof Experiment
Description:
Water Transit times and flowpaths in a microcatchment from two line ... traversing a one meter wide swathe of soil under saturated flow conditions, as ... –
Number of Views:67
Avg rating:3.0/5.0
Title: Water Storage in a till catchment: The Grdsjn Roof Experiment
1
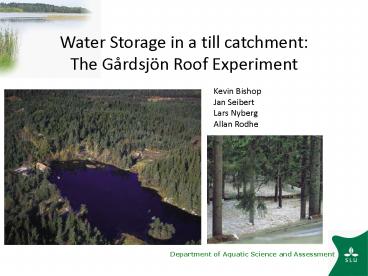
Water Storage in a till catchment The Gårdsjön
Roof Experiment
Kevin Bishop Jan SeibertLars Nyberg Allan Rodhe
2
(No Transcript)
3
Bibliography
- Nyberg, L., A. Rodhe and K. H. Bishop. (1999.)
Water Transit times and flowpaths in a
microcatchment from two line injections of 3H and
36Cl. Hydrol. Proc. 131557-1575 - Bishop, K. H., M. Hauhs, L. Nyberg, J. Seibert,
F. Moldan, A. Rodhe, H. Lange and G. Lischeid.
1998. The Hydrology of the Covered Catchment In
Experimental Reversal of Acid Rain Effects The
Gårdsjön Covered Catchment Experiment. H.
Hultberg and R. Skeffington, (eds.) Wiley Sons,
p. 109-136. - Seibert, J., K. Bishop, and L. Nyberg. 1998. A
test of TOPMODELs ability to predict spatially
distributed groundwater levels. Hydrological
Processes. 111131-1144. - Rodhe, A., L. Nyberg, and K. H. Bishop. 1996.
Water flowpaths and transit times in a small till
catchment from a step shift in the oxygen 18
content of water input. Water Resour. Res.
32(12)3487-3512 - Nyberg, L. 1996. Spatial variability of soil
water content in the covered catchment at
Gårdsjön, Sweden, Hydrol. Proc., 1089-103. - Nyberg, L. 1995a. Water flowpath interactions
with soil hydraulic properties in till soil at
Gårdsjön, Sweden, J. Hydrol., 170255-275. - Nyberg, L. 1995b. Soil- and groundwater
distribution, flowpaths and transit times in a
small till catchment. Comprehensive summaries of
Uppsala dissertations from the Faculty of Science
and Technology 97. 46 pp. - Nyberg, L., K. Bishop, A. Rodhe. 1993.
Importance of hydrology in the reversal of
acidification in till soils, Gårdsjön, Sweden.
Appl. Geochem. 261-66
4
G1 ROOF Catchment 100 m long central valley
drains the surrounding flanks
5
Storage Calculations
- Hydrometrically
- Vertical Equilibrium Model (198 mm)Monte Carlo
Uncertainty (/- 8 or 16 mm) - TDR Surveys (vertical insertion)
- Water Storage Balance
- Stable Isotope Step-Shift in Rainfall Inputs
6
Runoff Correlates to Groundwater Levels
Transmissivity Feedback
6
The numbered subareas refer to the lateral
aggregation of the catchment used in modeling
water storage that is described below
7
GW levels Correlate to each other
8
Total, pressure and elevation potential in the
equilibrium profile assumed by the Unit Gradient
Water Storage Model
3,4
9
Soil Depth
10
Soil Moisture Characteristic
Volumetric water content as a function of
pressure potential in soil from different soil
horizons. Each measured point represents the
average water content of 10 - 30 samples from
each horizon
11
Daily irrigation and water storage (total,
unsaturated, groundwater), as well as (b) runoff
and modeled evapotranspiration for a two year
period starting in April, 1991
12
GW Depth and Storage
13
Runoff as a function of Groundwater Fill and
Spill at 190 mm
14
Test 1 of Soil Storage TDR surveys
15
Soil Moisture (0-30 cm) and TWI
16
Test 2 Monte Carlo Uncertainty
17
Test 3 Changes in water storage relative to
amount of water in the catchment on April 1, 1991
13
18
Flow per unit contour on the boundaries between
subareas 2-1, (as a function of mean daily runoff
19
Distribution of lateral flow across the soil
profile, and days saturated at each depth
lateral flow per day when a given layer is
saturated and the residence time of water
traversing a one meter wide swathe of soil under
saturated flow conditions,
20
Water Turnover Time
The number of days between April 1991 and June
1992 when a given 10 cm layer was saturated at
GV182, and the turnover time of water traversing
a one meter wide swathe of soil under saturated
flow conditions, as well as the average annual
turnover time across this swathe
21
Water flowpaths and transit times in a small
till catchment from a step shift in the oxygen 18
content of water input. Water Resour. Res.
32(12)3487-3512 Rodhe, A., L. Nyberg, and K. H.
Bishop. 1996.
22
d18O of the input water to G1, from February 1990
to December 1993.
23
d18O of irrigation and runoff from G1 and of
runoff from the uncovered reference catchment F1,
February 1990 to December 1993.
24
Table 1. Water budgets for total, old and new
water in G1 during the transition period (mm).
a) Estimated from this water budget b) Estimated
from observations of groundwater levels, soil
depth and soil moisture characteristic curves
25
Fraction of new water in the runoff from G1
versus normal time
26
Mean transit time of the discharging water
expressed in normal time.
27
Fraction of new water in the runoff from G1
versus flow corrected-time
28
Transit time distribution obtained from the
break-through curve for new water (flow corrected
time). Also shown is an exponential transit
time distribution (Eq. 13) with the mean transit
time T 65 days (flow corrected time
29
Evapotranspiration (E) and runoff from G1 during
the transition period, separated into flows of
new and old water
30
TACK!
31
(No Transcript)
Recommended
CrystalGraphics Presentations


