
CS232 roadmap PowerPoint PPT Presentation
1 / 9
Title: CS232 roadmap
1
CS232 roadmap
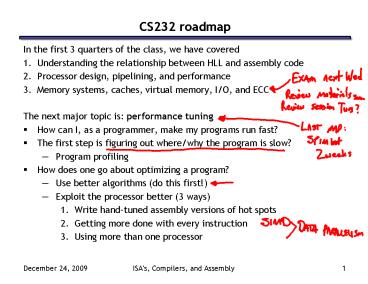
- In the first 3 quarters of the class, we have
covered - Understanding the relationship between HLL and
assembly code - Processor design, pipelining, and performance
- Memory systems, caches, virtual memory, I/O, and
ECC - The next major topic is performance tuning
- How can I, as a programmer, make my programs run
fast? - The first step is figuring out where/why the
program is slow? - Program profiling
- How does one go about optimizing a program?
- Use better algorithms (do this first!)
- Exploit the processor better (3 ways)
- Write hand-tuned assembly versions of hot spots
- Getting more done with every instruction
- Using more than one processor
2
Performance Optimization
- Until you are an expert, first write a working
version of the program - Then, and only then, begin tuning, first
collecting data, and iterate - Otherwise, you will likely optimize what doesnt
matter - We should forget about small efficiencies, say
about 97 of the time premature optimization is
the root of all evil. -- Sir Tony Hoare
3
Building a benchmark
- You need something to gauge your progress.
- Should be representative of how the program will
be used
4
Instrumenting your program
- We can do this by hand. Consider test.c --gt
test2.c - Lets us know where the program is spending its
time. - But implementing it is tedious consider
instrumenting 130k lines of code
5
Using tools to do instrumentation
- Two GNU tools integrated into the GCC C compiler
- Gprof The GNU profiler
- Compile with the -pg flag
- This flag causes gcc to keep track of which
pieces of source code correspond to which chunks
of object code and links in a profiling signal
handler. - Run as normal program requests the operating
system to periodically send it signals the
signal handler records what instruction was
executing when the signal was received in a file
called gmon.out - Display results using gprof command
- Shows how much time is being spent in each
function. - Shows the calling context (the path of function
calls) to the hot spot.
6
Example gprof output
Each sample counts as 0.01 seconds.
cumulative self self total
time seconds seconds calls
s/call s/call name 81.89 4.16
4.16 37913758 0.00 0.00 cache_access
16.14 4.98 0.82 1 0.82
5.08 sim_main 1.38 5.05 0.07 6254582
0.00 0.00 update_way_list 0.59
5.08 0.03 1428644 0.00 0.00
dl1_access_fn 0.00 5.08 0.00 711226
0.00 0.00 dl2_access_fn 0.00 5.08
0.00 256830 0.00 0.00 yylex
Over 80 of time spent in one function
Provides calling context (main calls sim_main
calls cache_access) of hot spot
index time self children called
name 0.82 4.26 1/1
main 2 1 100.0 0.82 4.26
1 sim_main 1 4.18
0.07 36418454/36484188 cache_access ltcycle 1gt
4 0.00 0.01 10/10
sys_syscall 9 0.00 0.00
2935/2967 mem_translate 16
0.00 0.00 2794/2824 mem_newpage
18
7
Using tools for instrumentation (cont.)
- Gprof didnt give us information on where in the
function we were spending time. (cache_access is
a big function still needle in haystack) - Gcov the GNU coverage tool
- Compile/link with the -fprofile-arcs
-ftest-coverage options - Adds code during compilation to add counters to
every control flow edge (much like our by hand
instrumentation) to compute how frequently each
block of code gets executed. - Run as normal
- For each xyz.c file an xyz.gdna and xyz.gcno file
are generated - Post-process with gcov xyz.c
- Computes execution frequency of each line of code
- Marks with any lines not executed
- Useful for making sure that you tested your whole
program
8
Example gcov output
Code never executed
14282656 540 if (cp-gthsize)
541 int hindex CACHE_HASH(cp, tag)
- 542 543 for
(blkcp-gtsetsset.hashhindex - 544
blk - 545
blkblk-gthash_next) - 546
547 if (blk-gttag tag
(blk-gtstatus CACHE_BLK_VALID))
548 goto cache_hit -
549 - 550 else -
551 / linear search the way list
/ 753030193 552 for (blkcp-gtsetsset.wa
y_head - 553 blk
- 554 blkblk-gtway_next)
751950759 555 if (blk-gttag
tag (blk-gtstatus CACHE_BLK_VALID)) 738747537
556 goto cache_hit
- 557 - 558
Loop executed over 50 interations on average
(751950759/14282656)
9
Conclusion
- The second step to making a fast program is
finding out why it is slow - The first step is making a working program
- Your intuition where it is slow is probably wrong
- So dont guess, collect data!
- Many tools already exist for automatically
instrumenting your code - Identify the hot spots in your code where time
is being spent - Two example tools
- Gprof periodically interrupts program
- Gcov inserts counters into code
- Well see Vtune in section, which explains why
the code is slow - If youve never tuned your program, there is
probably low hanging fruit - Most of the time is spent in one or two functions
- Try using better algorithms to speed these up
Recommended
