
Design of Engineering Experiments Part 10 Nested and SplitPlot Designs PowerPoint PPT Presentation
1 / 17
Title: Design of Engineering Experiments Part 10 Nested and SplitPlot Designs
1
Design of Engineering Experiments Part 10
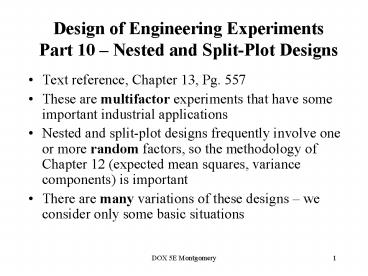
Nested and Split-Plot Designs
- Text reference, Chapter 13, Pg. 557
- These are multifactor experiments that have some
important industrial applications - Nested and split-plot designs frequently involve
one or more random factors, so the methodology of
Chapter 12 (expected mean squares, variance
components) is important - There are many variations of these designs we
consider only some basic situations
2
Two-Stage Nested Design
- Section 13-1 (pg. 557)
- In a nested design, the levels of one factor (B)
is similar to but not identical to each other at
different levels of another factor (A) - Consider a company that purchases material from
three suppliers - The material comes in batches
- Is the purity of the material uniform?
- Experimental design
- Select four batches at random from each supplier
- Make three purity determinations from each batch
3
Two-Stage Nested Design
4
Two-Stage Nested DesignStatistical Model and
ANOVA
5
Two-Stage Nested DesignExample 13-1 (pg. 560)
Three suppliers, four batches (selected randomly)
from each supplier, three samples of material
taken (at random) from each batch Experiment and
data, Table 13-3 Data is coded Minitab balanced
ANOVA will analyze nested designs Mixed model,
assume restricted form
6
Minitab Analysis Page 562
Factor Type Levels Values Supplier
fixed 3 1 2
3 Batch(Supplier) random 4 1 2 3
4 Analysis of Variance for purity Source
DF SS MS F
P Supplier 2 15.056 7.528
0.97 0.416 Batch(Supplier) 9 69.917
7.769 2.94 0.017 Error 24
63.333 2.639 Total 35
148.306 Source Variance Error
Expected Mean Square for Each Term
component term (using restricted model) 1
Supplier 2 (3) 3(2)
12Q1 2 Batch(Supplier) 1.710 3 (3)
3(2) 3 Error 2.639 (3)
7
Practical Interpretation Example 13-1
- There is no difference in purity among suppliers,
but significant difference in purity among
batches (within suppliers) - What are the practical implications of this
conclusion? - Examine residual plots pg. 562 plot of
residuals versus supplier is very important
(why?) - What if we had incorrectly analyzed this
experiment as a factorial? (see Table 13-5, pg.
561) - Estimation of variance components (pg. 565)
8
Variations of the Nested Design
- Staggered nested designs (Pg. 566)
- Prevents too many degrees of freedom from
building up at lower levels - Can be analyzed in Minitab (General Linear Model)
see the supplemental text material for an
example - Several levels of nesting (pg. 566)
- The alloy formulation example
- This experiment has three stages of nesting
- Experiments with both nested and crossed or
factorial factors (pg. 569)
9
Example 13-2 Nested and Factorial Factors
10
Example 13-2 Expected Mean Squares
Assume that fixtures and layouts are fixed,
operators are random gives a mixed model (use
restricted form)
11
Example 13-2 Minitab Analysis
12
The Split-Plot Design
- Text reference, Section 13-4 page 573
- The split-plot is a multifactor experiment where
it is not possible to completely randomize the
order of the runs - Example paper manufacturing
- Three pulp preparation methods
- Four different temperatures
- Each replicate requires 12 runs
- The experimenters want to use three replicates
- How many batches of pulp are required?
13
The Split-Plot Design
- Pulp preparation methods is a hard-to-change
factor - Consider an alternate experimental design
- In replicate 1, select a pulp preparation
method, prepare a batch - Divide the batch into four sections or samples,
and assign one of the temperature levels to each - Repeat for each pulp preparation method
- Conduct replicates 2 and 3 similarly
14
The Split-Plot Design
- Each replicate (sometimes called blocks) has been
divided into three parts, called the whole plots - Pulp preparation methods is the whole plot
treatment - Each whole plot has been divided into four
subplots or split-plots - Temperature is the subplot treatment
- Generally, the hard-to-change factor is assigned
to the whole plots - This design requires only 9 batches of pulp
(assuming three replicates)
15
The Split-Plot DesignModel and Statistical
Analysis
16
Split-Plot ANOVA
Calculations follow a three-factor ANOVA with one
replicate Note the two different error
structures whole plot and subplot
17
Alternate Model for the Split-Plot
Recommended
