
Collaborating Institutions Petersburg Nuclear Physics Institute PNPI, Gatchina, Russia Paul Scherrer
1 / 77
Title: Collaborating Institutions Petersburg Nuclear Physics Institute PNPI, Gatchina, Russia Paul Scherrer
1
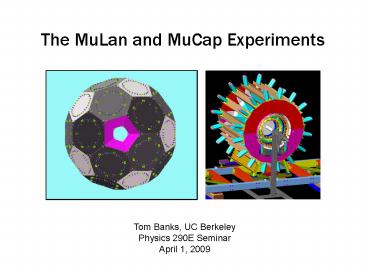
The MuLan and MuCap Experiments
Tom Banks, UC Berkeley Physics 290E Seminar April
1, 2009
2
Sister experiments
MuLan Precision measurement of the positive
muons lifetime.
MuCap Precision measurement of the negative
muons lifetime in hydrogen gas.
3
Similarities
- Both use a similar experimental technique
involving the muon lifetime to measure
fundamental weak interaction parameters.
4
Similarities
- Both use a similar experimental technique
involving the muon lifetime to measure
fundamental weak interaction parameters. - Both experiments were conducted in the same
beamline at the Paul Scherrer Institut (PSI), CH.
5
Similarities experiment location
Paul Scherrer Institut
Villigen, Switzerland
PSI Experimentierhalle, home to a 590 MeV ring
cyclotron
6
Similarities
- Both use a similar experimental technique
involving the muon lifetime to measure
fundamental weak interaction parameters. - Both experiments were conducted in the same
beamline at the Paul Scherrer Institut (PSI),
CH. - Overlap in personnel, equipment, expertise
7
Similarities
- Both use a similar experimental technique
involving the muon lifetime to measure
fundamental weak interaction parameters. - Both experiments were conducted in the same
beamline at the Paul Scherrer Institut (PSI),
CH. - Overlap in personnel, equipment, expertise
- Both recorded first physics data in fall 2004
and published their first results in the same
issue of PRL (July 20, 2007). The MuLan
result is used to obtain the MuCap result.
8
The MuLan experiment Muon Lifetime Analysis
9
Motivation
The most precise way of determining the Fermi
constant - one of three fundamental
parameters characterizing the electroweak
interaction - is from the mean life of the muon
10
Motivation
For a long time, the uncertainty in was
dominated by the higher-order QED corrections in
11
Motivation
In 1999, the theoretical uncertainty was reduced
from 30 ppm to less than 0.3 ppm, shifting the
focus to the muon lifetime, whose 18 ppm
precision had not improved in over 20 years.
12
Motivation
MuLans goal is to measure the positive muon
lifetime to 1 ppm, thereby determining the Fermi
constant to 0.5 ppm.
13
Experimental concept
Positive muons are stopped in a ferromagnetic
target disk, and the resulting decay positrons
are detected by a surrounding soccer-ball-shaped,
double-layered scintillator array
14
Experimental concept
To obtain the muon lifetime, the muon decay times
are histogrammed and fit with an exponential
tµ 2.2 µs
To achieve a 1 ppm lifetime measurement, it is
necessary to collect 1012 decay events.
15
Experimental apparatus
a scintillating tile
a house of tiles
16
Experimental apparatus
the detector ball
17
Experimental apparatus
Physics is messy
18
Beamline kicker
1. 28.8 MeV/c polarized muons produced from pions
that decay at rest near production target surface
2. Kicker muon beam on/off
3. Separator e/e- removal
4. Quadrupoles beam steering
5. Target area
pE3 beamline _at_ PSI
19
Lifetime spectrum
The kicker is used to pulse the 2 MHz DC muon
beam, generating a lifetime spectrum with a
unique shape
(beam-on)
(beam-off)
20
Systematics
In precision experiments involving large
statistics, its all about the systematics...
When measuring the muon lifetime, the primary
challenge is avoiding early-to-late changes in
the spectrum
early
log(counts)
late
time
- Such distortions can arise from
- electron pileup and electronics deadtime effects
- instrument shifts in gain, threshold, or time
response - changes in spatial acceptance due to muon
polarization and spin rotation
21
Systematics muon polarization
Due to parity violation in the weak interaction,
the decay positron is preferentially emitted in
the direction of the muons polarization
?
22
Systematics muon polarization
The muon spin also precesses in time according to
the strength of the surrounding magnetic field
The combined effect of these two phenomena is
that geometric variations in detector acceptance
can produce time-dependent distortions in the
muon lifetime spectrum.
23
Systematics muon polarization
How to minimize control polarization effects?
Detector
- Point-like symmetry
- Large solid-angle coverage (70)
- Diametric panel pairs
Target
- Use large magnetic fields to ensure that the
spin precession period is much less than tµ
24
2004 muon targets
- Arnokrome III (AK-3)
- 30 Cr, 10 Co, 60 Fe
- High internal B field ( 4000 G)
- 0.5-mm thick, 50-cm diameter
- Pressed sulfur
- Held in Kapton wrapping
- 130 G field from Halbach magnet
- 20-cm diameter
B
B
25
2004 muon targets
- Arnokrome III (AK-3)
- 30 Cr, 10 Co, 60 Fe
- High internal B field ( 4000 G)
- 0.5-mm thick, 50-cm diameter
- Pressed sulfur
- Held in Kapton wrapping
- 130 G field from Halbach magnet
- 20-cm diameter
B
B
Not used for final result because of large
fraction of errant muon stops
26
Systematics electron pileup
- The electronics deadtime results in
missed electron events, measurably
distorting the lifetime spectrum - The problem can be fixed by adding
missed signals back in by sampling from a
fixed-width shadow window
e
detector tile pair
e
Pulse resolving time (42 ns)
27
Systematics table (2004 data)
The statistical error is 9.6 ppm (from 1.8 x 10¹⁰
decay events), so the 2004 measurement is
statistics-limited.
28
Systematics table (2004 data)
Most of the systematics concerns were
electronics-related.
29
2007 result
The 1.8 x 10¹⁰ decay events in the 2004 MuLan
AK-3 data yielded the result highlighted below
(D. Chitwood et al., PRL 99, 032001 (2007))
1.166 370(10) 1.166 371(6) 1.166
352(9) 1.166 367(5)
Previous world average MuLan (2007) Updated
world average FAST (2007) Updated world average
2.197 030(40) 2.197 013(24) 2.197
019(21) 2.197 083(35) 2.197 035(18)
9 ppm
(21)(11)
5 ppm
(32)(15)
4 ppm
30
History of muon lifetime experiments
16 ppm
18 ppm
11 ppm
1 ppm
31
Status future
- Improvements in 2006 2007 MuLan data
- higher statistics 2 sets of 1012 decays in
AK-3 and quartz targets - AK-3-lined vacuum pipe provided better beam
corridor to target than previous He bag - improved electronics
- Data analysis
- analysis in progress pileup issues are main
concern - hope to open the box (unblinding) around the
end of May 2009 - hope to publish 1 ppm result by the end of 2009
32
The MuCap experiment Muon Capture in hydrogen
33
Introduction to muon capture
- Semileptonic weak interaction process
- Relatively large, fixed momentum transfer
n
?µ
q0
W
p
µ-
34
Introduction to muon capture
The fundamental leptonic and quark currents in
muon capture possess the simple V-A structure
characteristic of the weak interaction.
d
?
u
µ
35
Introduction to muon capture
In reality, the QCD substructure of the nucleon
complicates the weak interaction physics the
effects are encapsulated in the charged currents
four induced form factors
?
n
p
µ
36
The pseudoscalar form factor gP
- The pseudoscalar gP is by far the least well
known of the form factors - Modern theories make relatively precise (3)
predictions for gP , but existing
experimental results are inconsistent.
values and q2-dependence known from EM form
factors via CVC
value known from ßdecay q2-dependence known
from neutrino scattering
37
Measuring gP
- The pseudoscalar form factor participates in any
process involving the nucleons charged
current - beta decay
- neutrino scattering
- pion electroproduction
- muon capture
- Muon capture is the most attractive because of
its - large momentum transfer
- comparative ease of measurement
- model-independent connection to gP
- Muon capture offers a unique probe of the
nucleons electroweak axial structure
38
Muon capture experiments
- Ordinary muon capture (OMC) in hydrogen
- branching ratio 103
- gt 5 neutron counting measurements
- 1 muon lifetime measurement
- Radiative muon capture (RMC) in hydrogen
- variable momentrum transfer ? more sensitive to
pion pole than OMC - branching ratio 108
- only 1 measurement to date, counted photons gt
60 MeV - Muon capture in nuclei (helium, )
39
gP from muon capture experiments in H2
- Variety of experiments using liquid and gas
hydrogen targets - Plotting the reported gP values this way is
somewhat misleading, as the extraction of
gP depends upon assumptions about hydrogen
kinetics
40
Muon kinetics in H2
triplet
para
ortho
singlet
- Negative muons in pure hydrogen form a variety
of atomic and molecular states - Contamination from Zgt1 elements introduces yet
more pathways
41
Muon kinetics in H2
triplet
para
ortho
singlet
- Each muonic state has a unique nuclear capture
rate - The measured capture rate is some combination of
contributing rates - Many of the important kinetics transition rates
are poorly known
42
Motivation
Prior to the advent of MuCap, the situation
surrounding gP was inconclusive, in large part
due to uncertainties in the kinematics of muonic
molecules.
? 8.26 0.23
43
Experimental concept
MuCap measures the rate of nuclear muon capture
by the proton by stopping negative muons in
hydrogen gas and observing the time spectrum of
decay electrons.
44
Experimental concept
- Muon detectors
- µSC fast timing of muon arrivals
- µPC1, TPC 3D tracking of incoming muon
trajectories - Electron detectors
- ePC1, ePC2 3D tracking of outgoing electron
trajectories - eSC fast timing of outgoing decay electrons
45
Experimental concept
To obtain the muon lifetime, the muon decay times
are histogrammed and fit with an exponential,
just as in MuLan
tµ 2.2 µs
TeSC-TµSC (ns)
To achieve a 10 ppm lifetime measurement, it is
necessary to collect 1010 decay events.
46
The Lifetime Technique
log(counts)
muon decay time
- Negative muons can disappear via decay or
nuclear capture - Positive muons can only decay
- The muon capture rate can be obtained from the
small (0.16) difference between the
disappearance rates (i.e. inverse lifetimes) of
the two species
47
Hydrogen target
- We use an ultra-pure, low-density (1 of LH2)
hydrogen gas target, which is an optimal
compromise among competing demands - suppression of µp triplet and pµp molecule
formation, so most captures (96) proceed
from the µp singlet state - minimization of µp diffusion
- preservation of substantive muon stopping power
µp??
triplet
pµp
pµp
para
ortho
singlet
µZ
48
Time Projection Chamber
- Active target H2 gas is both muon stopping
target and chamber gas - First of its kind
- Provides three-dimensional tracking of incoming
muons, thus enabling identification of
clean muon stops - Constructed of bakeable materials (quartz,
ceramic)
49
Experimental goals
1010 µ- decay events in pure hydrogen gas(cZ lt
10 ppb, cd lt 1 ppm)
10 ppm measurement of µ- disappearance rate
1 determination of µp nuclear capture rate ?S
7 determination of gP
50
Experimental apparatus
51
Experimental apparatus
52
Identifying muon stops
x
y,t
muon stop (Bragg peak)
z
y,t
muon entrance (low energy loss)
53
Lifetime spectrum
- The signal-to-background ratio of the lifetime
histogram is enhanced by - imposing a 25 µs separation between muon
arrivals - requiring coincident hits in all 3 electron
detectors - imposing an impact cut on the muon/electron
vertex
54
Fitting the lifetime spectrum
- We recorded roughly 1.6 x 10⁹ negative muon
decay events during our first physics run
in 2004. - The muon disappearance rate is obtained by
fitting the measured decay time spectrum
with an exponential function of the form
55
Fit result
- The result for the fitted µ disappearance rate
is - However, the lifetime spectrum is not a pure
exponential...
56
Correction Zgt1 impurities
triplet
para
ortho
singlet
- Muons preferentially transfer to Zgt1 impurities
in the hydrogen gas (transfer rates ?pZ
10101011 Hz ?of 106 Hz) - Ensuing nuclear captures distort the lifetime
measurement (for C,N,O, ?Z 40100 kHz,
whereas ?S 0.7 kHz) - Circulation system did a great job of
suppressing impurity levels in 2004, but
there was still nonnegligible level of
contamination ( 50 ppb O from humidity)
57
Correction Zgt1 impurities
The TPC can also monitor Zgt1 nuclear captures.
58
Correction Zgt1 impurities
- Effect of impurities on the muon disappearance
rate is proportional to the capture yield
Y, the number of observed TPC captures per good
muon stop - Proportionality for contaminants N,O is
established by calibration measurements in
which we intentionally doped the gas - The capture-yield-based correction is
59
Correction muon scatters
muon scatter signature
- Sometimes a muon scatters off a proton,
mimicking a stop in the TPC - Scatter events are dangerous because the
scattered muons can stop in surrounding Zgt1
detector materials - We can catch some of these events, but the
signature is not always robust
60
Correction muon scatters
- Differential study of scatter events indeed
exhibits a higher disappearance rate - Unfortunately, we must rely on simulations to
estimate our identification efficiency - We remove the scatters we find, and
conservatively assume 50 inefficiency
61
Correction deuterium µd diffusion
µd
µp
r 1 mm
- Muons preferentially transfer from µp ? µd
- H2 gas is more transparent to µd atoms, so
they diffuse faster farther - The rapid diffusion can raise the observed muon
disappearance rate in two ways - muons can diffuse out of the decay vertex
reconstruction radius - muons can diffuse into surrounding detector
materials and capture there
62
Correction deuterium µd diffusion
?
Production Data
Deuterium-doped data
??µd
cd (ppm)
122(5)
1.44(13)
0
Extrapolated Result
We perform a zero extrapolation to correct for
the effects of µd diffusion.
63
Correction deuterium µd diffusion
- The deuterium concentrations were determined
using two complementary methods - External measurements of gas samples
- From data analysis of the ? vs. impact
parameter dependence - The results from the two approaches were
consistent - The zero extrapolation yields
64
Correction µp diffusion
- Although µp diffusion distances are small ( 1
mm), the scattering of outgoing decay
electrons by the aluminum pressure vessel
magnifies the behavior - By combining the electron scattering
distribution (i.e. the impact parameter
distribution) with a simple model of isotropic µp
diffusion, we calculate
65
Correction pµp molecule formation
- Even in perfectly clean, pure hydrogen gas,
muons will slowly form pµp molecules - The nuclear capture rates in pµp molecules are
lower than in the µp atom
66
Correction pµp molecule formation
- In order to extract the µp singlet capture rate,
we have to make some assumptions about pµp
kinetics - We use conservative averages of the published
pµp formation and transition rates to obtain
67
Systematics table (2004 data)
Source Uncorrected rate Zgt1 gas impurities Muon
scatter events µd diffusion µp diffusion pµp
molecule formation Muon detector
inefficiencies Analysis consistency µp bound
state decay rate Adjusted µ- disappearance rate
455 886.6 19.2 3.1 10.2 2.7 23.5 12.3 455
887.2
12.6 5.0 3.0 1.6 0.5 7.3 3.0
5.0 16.8
68
2007 results the capture rate
Subtracting the positive muon lifetime measured
by MuLan yields
13.7 Hz of the uncertainty is statistical, and
10.7 Hz is systematic.This result is consistent
within 1s with the latest theoretical
calculations, which predict 711.5 4.5 Hz. Both
results appeared in the July 20, 2007 issue of
Physical Review Letters. (PRL 99, 032002 and
032003 (2007))
69
2007 results gP
From the capture rate we can extract the value
which is consistent with the ChPT prediction of
8.260.23, and therefore corroborates the modern
understanding of the role of chiral symmetries in
QCD.
70
Status future
- During 2005 ? 2007 MuCap continued to collect
data of superior quality - Analysis is in progress the primary challenge
now is systematics - We expect to reduce the statistical and
systematic errors by at least a factor of 2,
reaching the design goal of a 1 capture
measurement.
- Higher statistics ( 1.5 1010 decay events)
- Muon kicker installed in the beamline,
increasing good muon stop rate by 3x - Cleaner, better-monitored hydrogen gas ?
Zgt1 impurity content was reduced by a factor of
2 ? deuterium content was reduced by a
factor of 10 (cd lt 100 ppb!) by
introducing an isotopic separation column ?
humidity sensors installed - The TPC operated at a higher voltage, with
increased sensitivity - Neutron detectors were added to the apparatus
in hopes of measuring molecular kinetics
parameters - Analog TPC and eSC information is now being
recorded
71
The next phase...
MuSun
- Goal measurement of the µd capture rate to 1
- Calibrating the sun
- Determines L1A, of relevance to astrophysical
studies
72
Collaborating InstitutionsPetersburg Nuclear
Physics Institute (PNPI), Gatchina, RussiaPaul
Scherrer Institute (PSI), Villigen,
SwitzerlandUniversity of California, Berkeley
(UCB and LBNL), USAUniversity of Illinois,
Urbana-Champaign (UIUC), USAUniversite
Catholique de Louvain, BelgiumUniversity of
Kentucky, USABoston University, USA
The MuCap experiment is supported in part by the
United States Department of Energy and the
National Science Foundation.
www.npl.uiuc.edu/exp/mucapture
73
(No Transcript)
74
(No Transcript)
75
Theoretical predictions for gP
?
n
W
p
µ
p
- Pion pole is dominant contributor to the
pseudoscalar form factor - PCAC yielded an expression for the pseudoscalar
more than 30 years ago - Modern chiral perturbation theories (ChPT),
which are low-E effective QCD, reproduce
the PCAC result in systematic expansions - Present-day heavy baryon ChPT (HBChPT) predicts
gP(q02) 8.26 0.23
76
PSI experimental hall facilities
Muon Source PSI accelerator (ring cyclotron)
generates 590 MeV proton beam (v
0.8c) protons strike a spinning graphite
target and produce pions pions decay to muons
Muon Beam Properties µ or µ selectable
Momentum 30-40 MeV/c Max intensity 50 kHz
77
Method Lifetime technique
e?
Data Acquisition
Telectron
H2
µ?
Tmuon
DT
log(counts)
- Fill histogram with muons lifetime ?T
- Repeat N times for a 1/vN precision lifetime
measurement
DT
Recommended
