Global Circulation Model - PowerPoint PPT Presentation
1 / 38
Title:
Global Circulation Model
Description:
Poleward flow from the horse latitudes to 60 leads to the westerlies winds ... In Northern Hemisphere, jet stream takes a more southerly track ... – PowerPoint PPT presentation
Number of Views:35
Avg rating:3.0/5.0
Title: Global Circulation Model
1
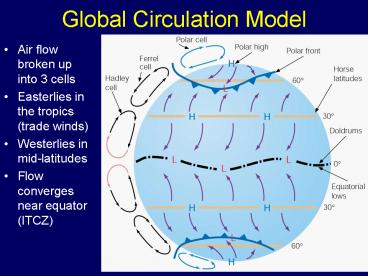
Global Circulation Model
- Air flow broken up into 3 cells
- Easterlies in the tropics (trade winds)
- Westerlies in mid-latitudes
- Flow converges near equator (ITCZ)
2
Global Circulation Model
- Sinking air aloft near 30o
- ? high pressure, dry (desert climates)
- ? weak winds (horse latitudes)
- Poleward flow from the horse latitudes to 60
leads to the westerlies winds with a strong
westerly component due to the Coriolis force - Heat transfer between poles and equator is
significant in the mid-latitudes - In polar regions, air tries to flow from the pole
toward the equator, but the flow is directed
westward due to the Coriolis force. The result is
polar easterlies.
3
Atmospheric Regions
4
Precipitation Patterns
- Why are deserts located along the same latitudes
globally? - ITCZ and mid-latitudes (45) are wet regions
- Polar regions are dry
5
Global Circulation
- Important result
- Global circulation acts to redistribute the
uneven heating of the earth - Always have weather due to the uneven heating of
the surface of the earth
6
January Weather Patterns
7
July Weather Patterns
8
January Upper-Air Weather Patterns
9
July Upper-Air Weather Patterns
10
Global Ocean Currents
11
Gulf Stream Warm Current
12
West Coast Cold Current
13
Upwelling
14
Normal Pacific Circulation
The atmospheric part of this is called the Walker
circulation
15
Normal Sea Temperatures
16
Southern Oscillation
- Changes in the Walker Circulation
- Normally wind blows from east to west in the
equatorial Pacific (easterlies) - Low pressure in the western Pacific and high
pressure in the eastern Pacific - Change in pressure pattern across the equatorial
Pacific reduces the strength of the easterlies - El Niño closely linked to Southern Oscillation
17
El Niño Southern Oscillation (ENSO)
- First observed by fishermen in Peru and Ecuador
- Warm waters ? loss of nutrients ? fewer fish
- Affects weather patterns across the globe
- El Niño because it occurs around Christmas
- An El Niño event is defined by warming of sea
surface temperatures (SSTs) along the equator
from S. America to about 5,000 miles into the
Pacific - Weak events 1C Strong events 4C
18
Buoys
- Use a buoy monitoring network in equatorial
Pacific to monitor conditions - Provides surface winds, air temperature, sea
surface temperatures and currents in upper
several hundred feet of ocean
19
How do we get to El Niño?
- Change in Walker circulation causes surface
pressure to decrease in East Pacific and rise in
West Pacific ? reduces gradient across the
Pacific - Trade winds weaken or reverse, i.e., normal
easterly winds weaken or become westerly - With weaker trade winds, warm water that piled
up in West Pacific sloshes eastward - Low and high pressure areas move creating
different precipitation patterns
20
Walker Circulation Variation
21
El Niño Conditions
22
El Niño Ocean Temperatures
23
SST Anomalies During1997-1998 El Niño Event
24
SST Anomalies During1997-1998 El Niño Event
25
Consequences of El Niño
- Most noticeable during winter months
- Clouds and precipitation patterns change across
the globe - In Northern Hemisphere, jet stream takes a more
southerly track - Wetter in CA, big coastal storms
- Warmer than normal in northern U.S.
- Drought in Pacific Northwest wet along Gulf
Coast - More hurricanes in eastern and central Pacific
due to higher SSTs
26
Effects of El Niño in U.S.
27
Global Perspective (El Niño conditions)
28
La Niña
- Typically follows El Niño as atmosphere
overcorrects - Normal Walker circulation strengthens
- Unusually cold water in eastern Pacific
- Opposite to El Niño in terms of SST and pressure
patterns across equatorial Pacific - Not quite opposite in changes in global patterns
- Cold air outbreaks in northwestern and northern
U.S. - May lead to drought conditions across
southern/western U.S. (1988, 1998, 2006 in OK
TX)
29
SST Anomalies During1998-1999 La Niña Event
30
SST Anomalies During1985 La Niña Event
31
Effects of La Niña in U.S.
32
SST Anomalies Last Semester
33
SST Anomalies Now
34
Variation of SST Anomalies with Time
35
Southern Oscillation Index
- SOI Pressure at Tahiti Pressure at Darwin
- pressure is expressed as departure from normal
- Negative Values ? Weak Walker Circulation
- (El Niño)
- Positive Values ? Strong Walker Circulation
- (La Niña)
36
La Niña
El Niño
37
The Connection to Atlantic Hurricanes
- Atlantic hurricanes are less common during El
Niño and more common during La Niña - Anomalous atmospheric heating during an El Niño
event results in increased upper-level winds over
the tropical Atlantic ? increases vertical wind
shear and weakens tropical cyclones - 2005 (Katrina, Rita, WilmaZeta!) was a La Niña
year - 2006 (only to Isaac!) was an El Niño year
38
For more on hurricanes
- Visit the National Hurricane Center at
http//www.nhc.noaa.gov - Peruse the frequently asked questions
http//www.aoml.noaa.gov/hrd/tcfaq/tcfaqHED.html
For more on El Niño/La Niña
- Visit the Climate Prediction Center at
http//www.cpc.ncep.noaa.gov/products/precip/CWlin
k/MJO/enso.shtml


