
LowLevel Lead Exposure: The Ongoing Search for a Threshold PowerPoint PPT Presentation
1 / 51
Title: LowLevel Lead Exposure: The Ongoing Search for a Threshold
1
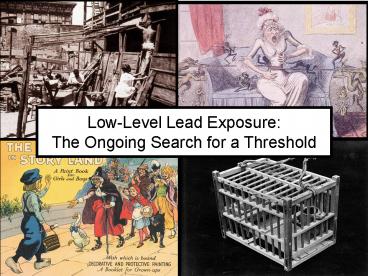
Low-Level Lead ExposureThe Ongoing Search for a
Threshold
2
An Element of Toxicity
3
Sequela of Childhood Lead Poisoning
Perlstein MA, Attala R. Clinical Pediatrics
19665282-298.
4
Mental Health Problems in Children by Tooth Lead
Concentration
Needleman HL, et al. NEJM 1979301163.
5
IQ deficit linked with an increase in blood lead
from 10 ??g/dl to 20 ?g/dl
- Study Estimated Loss
- Hawk (1986) 2.6
- Hatzakis (1987) 2.7
- Fulton (1987) 2.6
- Yule (1981) 5.6
- Bellinger (1992) 5.8
- Dietrich (1992) 1.3
- Baghurst (1992) 3.3
- Silva (1988) 1.5
6
Binder S, Falk H. Strategic plan for the
elimination of childhood lead poisoning. Atlanta
Centers for Disease Control, 1991.
7
Percent of Preschool Children Exceeding Selected
Blood Lead Levels, NHANES II - III
Pirkle JL, et al. Environ Health Perspect
1998106745-50.
8
Lead Toxicity - Still A Major Public Health
Problem
- Lead toxicity is epidemic in parts of U.S.
- Major environmental justice problem.
- Evidence of adverse effects below 10 ?g/dl.
- Systemic toxin associated with numerous adverse
conditions and diseases in humans.
9
Lead-associated Reading Deficits in U.S. Children
Reading Score
Blood lead levels (?g/dl)
Lanphear BP, et al. Public Health Reports
2000115521-529.
10
Canfield R, et al. NEJM 20033481517-1526.
11
Relationship of Lead-IQ Scores among Children
for Seven Prospective Lead-Exposed Cohorts
120
Boston
110
Mexico
Port Pirie
100
IQ
90
Cleveland
Cincinnati
80
Rochester
Yugoslavia
70
0
10
20
30
40
50
60
Concurrent Blood Lead (µg/dl)
12
Relationship of Concurrent Blood Lead
Concentration with Childrens Intellectual
Function using a Restricted Cubic Spline Function
105
100
IQ
95
90
85
0
5
10
15
20
25
30
35
40
45
50
Concurrent Blood Lead (µg/dL)
13
Relationship of Concurrent Blood Lead
Concentration with Childrens Intellectual
Function
105
Restricted Cubic Spline
Log-linear
100
IQ
95
90
85
0
5
10
15
20
25
30
35
40
45
50
Concurrent Blood Lead (µg/dL)
14
Estimated Lead-associated IQ Deficits by
Concurrent Blood Lead Concentration, 5th to 95th
percentile
Range of Blood Lead Estimated IQ
Deficit (95 CI) 2.4 to 30 µg/dL 6.9
(4.2, 9.4) 2.4 to 10 µg/dL 3.9
(2.4, 5.3) 10 to 20 µg/dL 1.9 (1.2,
2.6) 20 to 30 µg/dL 1.1 (0.7,
1.5)
Lanphear BP, et al. EHP 2005113894-899.
15
Relationship of Concurrent Blood Lead
Concentration with Childrens Intellectual
Function at Blood Lead Levels Above and Below 10
?g/dL
105
Log-linear model
Peak blood lead 7.5 µg/dL
100
Peak blood lead lt7.5 µg/dL
IQ
95
p 0.015
90
85
0
10
20
30
40
50
Concurrent Blood Lead (µg/dL)
16
Neuronal Growth in Early Childhood
17
Effects of Lead Exposure on Neurite Length of
Dopaminergic Neurons
Neurite Length (microns)
?g/dL equivalent of blood lead
Schneider JS. Neurotox Teratol 200325555-559.
18
Body Burdens of Lead in Ancient Peoples, Typical
American and Overt Lead Poisoning
19
Reading Scores by Serum Cotinine in US Children,
NHANES III, 1998-1994
92.5
Reading Score
90.0
87.5
3.0
2.5
2.0
1.5
1.0
0.5
0.0
Cotinine (ng/ml)
Yolton K, et al. Environ Health Perspect
200511398-103.
20
Relationship of Tobacco Use during Pregnancy and
Birthweight
England LJ, et al . Am J Epidemiol
2001154694-701.
21
Risk of Premature Birth by Exposure to
Environmental Tobacco Smoke
Adjusted Odds Ratio
Hair Nicotine (?g/g)
Jaakkola JJK, et al. Env Health Persp
2001109557-561.
22
Iceberg Phenomenon
Tip of the Iceberg
Last JM. The iceberg. Lancet 1963228-31.
23
Association of Blood Lead Levels and Delinquency
in Adolescents
Dietrich KN, et al. Neurotox Teratol
200123511-518.
24
Number of Arrests by Childhood Lead Exposure
The Cincinnati Lead Study
Number of Arrests
Accounting for birthweight, age, prenatal
tobacco exposure, maternal age at delivery,
maternal IQ, maternal arrest history, HOME Score.
25
Relationship of Lead Exposure and Murder Rate
(/100,000) in the U.S.
Nevin R. Environmental Research 2000831-22
26
Verb Generation Task by Lifetime Measure of Lead
Exposure
High Lifetime Mean Blood Lead (26 ?g/dL)
Low Lifetime Mean Blood Lead (7.6 ?g/dL)
The brightness represented the strength of the
brain activation, with red as the strongest
followed by yellow, green, and blue.
27
Brain Volume Loss Associated with Childhood Lead
Exposure
Cecil K, et al. unpublished data
28
Temporal-Occipital Cortex
Cecil K, et al. unpublished data
29
Risk of Dental Caries by Blood Lead Level in US
Children and Adolescents
Odds Ratio
Blood Lead Level
Moss M, et al. JAMA 19992812294-2298.
30
Risk for Spontaneous Abortion by Maternal Blood
Lead Concentration
Odds Ratio
Blood Lead (?g/dL)
Borja-Aburto VH, et al. Am J Epidemiol
1999150590-597.
31
An Element of Deception
32
- Prevention is easy. Paint containing lead
should never be employed ... where children,
especially young children, are accustomed to
play - A.J. Turner, 1908
33
Countries Banning Lead-based Paints
- France 1909
- Belgium 1909
- Austria 1909
- Tunisia 1922
- Greece 1922
- Czechoslovakia 1924
- Great Britain 1926
- Sweden 1926
- Belgium 1926
- Poland 1927
- Spain 1931
- Yugoslavia 1931
- Cuba 1934
34
Consumption of Lead in the United States
Consumption of Lead in the United States
GasolineAdditives
WhiteLeadPaint
LEAD CONSUMPTIONIN 1000 METRIC TONS
YEAR
35
Cater to the Children
http//www.cincinnatichildrens.org/leadadvertising
/
36
"Our victories have been in the deferral of
implementation of certain regulations."
- Werner Mayer, President
- Lead Industries Association
37
(No Transcript)
38
Why not change the blood lead level of concern at
this time?
- There are no effective clinical interventions to
lower blood lead for children with levels lt 10
µg/dL - Children cant be classified as having blood lead
levels lt or gt 10 µg/dL because of the inaccuracy
inherent in laboratory testing - There is no evidence of a threshold thus,
lowering the level of concern would be
arbitrary and provide uncertain benefits
39
An Element of Prevention
40
Decline in Childrens Blood Lead Levels due to
Regulation
Lead-Based Paint Poisoning Prevention Act
Ban on Lead Solder in Canned Foods (1995)
Lead in Plumbing Ban (1986)
Begin Phase-Out of Leaded Gasoline
Lead-Based Paint Hazard Reduction Act (1992)
Residential Lead Paint ban (1978)
Year
Source CDC
41
Levels of Prevention
- Primary
- Secondary
- Tertiary
42
Why Primary Prevention?
- Adverse effects of lead are persistent.
- Adverse effects of lead are systemic.
- Chelation does not result in improved
neurobehavioral outcomes. - No discernable threshold for adverse effects of
lead exposure. - Prevention is cost-beneficial.
43
Steps to Prevent ChildhoodLead Exposure
- Identify sources of lead
- Identify unacceptable levels of lead in
contributing sources - Test efficacy and safety of interventions to
reduce lead exposure - Develop and implement regulations and screening
programs.
44
Pathways of Childhood Lead Exposure
45
Percent Increase in Blood Lead from Sources of
Lead Exposure during Early Childhood
Percent Increase
Lanphear BP, et al. Journal of Pediatrics
200214040-47.
46
Frequency of Mouthing Behaviors during Early
Childhood
Percent
Months of Age
Lanphear BP, et al. Journal of Pediatrics
200214040-47.
47
Contribution of Lead-Contaminated Floor Dust to
Childrens Blood Lead
Floor Dust Lead (?g/ft2)
Lanphear BP, et al. Environmental Research
19987951-68.
48
Correlation of Dust Lead Results for Research
Participants vs Technicians
Roda S, et al. in preparation
49
Health Outcomes and Measures of the Environment
Study
Enroll Women lt 16 weeks gestation (n 400)
Conduct prenatal surveys, collect maternal urine
and blood samples for assessing fetal exposure
to toxicants
Collection of Biomarkers and exposure assessment
in early childhood
Randomization
Meconium Collection
Injury Control Group (n 200)
Lead Hazard Group (n 200)
12 - month visit
12 - month visit
24 - month visit
24 - month visit
36 - month visit
36 - month visit
12, 24 and 36-Month Outcomes Exposures and
Biomarkers for Pesticides, Lead and
Cotinine Behavior, Cognition and Executive
Function Hearing and Growth
50
Implications For Prevention
- Emphasis to shift from screening children to
screening houses, yards and water. - Empirically-derived health-based standards for
lead in house dust, soil and water are needed. - Randomized trials to assess if lead hazard
controls are effective in preventing exposure. - Studies to examine adverse effects of lead
exposure at lower blood lead concentrations. - Eliminate all non-essential uses of lead and
develop regulations to control lead emissions.
51
Until effective standards for the domestic
environment are devised, it is likely that
children will continue to be employed as
biological indicators of substandard housing.
- Donald Barltrop, 1974
Recommended
