

NOAA Hydroacoustic recordings of an EPR Swarm PowerPoint PPT Presentation
1 / 9
Title: NOAA Hydroacoustic recordings of an EPR Swarm
1
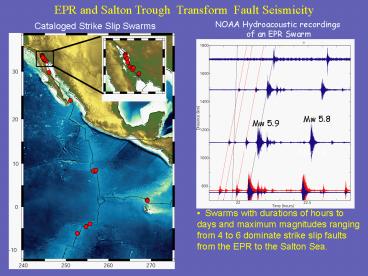
NOAA Hydroacoustic recordings of an EPR Swarm
EPR and Salton Trough Transform Fault Seismicity
Cataloged Strike Slip Swarms
Mw 5.8
Mw 5.9
Mw 5.9
Mw 5.8
- Swarms with durations of hours to days and
maximum magnitudes ranging from 4 to 6 dominate
strike slip faults from the EPR to the Salton
Sea.
2
EPR Transform Fault Prediction Algorithm
If for 5.5 years, starting on on May 23rd, 1996,
every time there was a Mgt2.5 (i.e. ASLgt207)
earthquake on the Discovery or Gofar faults, you
issued a prediction of a magnitude 5.4-6.2
earthquake within 15 km and one hour of the
potential foreshock, you would have achieved a
probability gain of 500-1000
3
- 2005 Swarm
- Obsidian Buttes
M 5.1
Largest EQ M 5.1 Total M 5.3
4
- Microseismicity Migration and Geodetic
Deformation Signals precede the - largest EQ
M 5.1 EQ
5
InSAR Data Synthetics
6
Aseismic Fault Slip Model
profile
Aseismic slip shallower than seismicity
Lohman and McGuire, 2006
7
Stressing rate and seismicity
- Assume stressing-rate history
- Exponential decay
- Vary As
- Prefer range 15-25
- Vary stress jump magnitude
- Consistent with InSAR coulomb stress change
- 3bars/5 days
8
Previous Swarms
9
New GPS
- This study
- CRRS-GLRS
- New PBO stations in October 2005
- Could constrain swarm evolution next time
Swarm
10
The Galapagos Transform
- Two major swarm episodes in t-phase catalog,
one of which was also recorded by a temporary
seismometer array on the islands. - The magnitude vs time pattern cannot be
explained by a superposition of aftershock
sequences
Roland et al., 2004
Recommended

