
Earthquaketriggered increase in sediment delivery from an active mountain belt
1 / 19
Title:
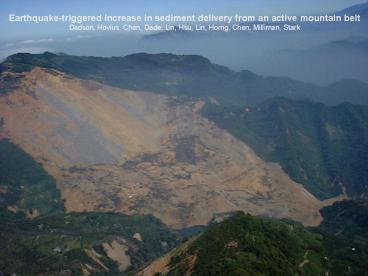
Earthquaketriggered increase in sediment delivery from an active mountain belt
Description:
Earthquake-triggered increase in sediment delivery from an active mountain belt. Dadson, Hovius, Chen, Dade, Lin, Hsu, Lin, Horng, Chen, Milliman, Stark. Study ... –
Number of Views:179
Avg rating:3.0/5.0
Title: Earthquaketriggered increase in sediment delivery from an active mountain belt
1
Earthquake-triggered increase in sediment
delivery from an active mountain belt Dadson,
Hovius, Chen, Dade, Lin, Hsu, Lin, Horng, Chen,
Milliman, Stark
2
Study Location
- Tectonically active
- High precipitation
3
Study Objectives/Questions
- How much sediment is generated by an earthquake
of a given magnitude? - How long does sediment take to travel from
mountain hillslopes to rivers and the sea? - What evidence of past earthquakes might be
recorded in ocean deposits?
4
Natural Experiment 1996-2001
August 1996 Typhoon Herb TWD 1.2
km3 September 1999 Chi-Chi Earthquake Mw
7.6 July 2001 Typhoon Toraji TWD 0.8 km3
5
Earthquake- and rainfall-triggered landslides
Chi-Chi Earthquake - 20,000 landslides
- most within 0.2g contour - 56 reactivated
during typhoon Toraji Typhoon Toraji -
30,000 landslides - 80 on undisturbed land
6
Earthquake- and rainfall-triggered landslides
Chi-Chi Earthquake -exponential decay away
from epicenter Typhoon Toraji -increase in
disturbed land with proximity to
fault Suggests substrate was preconditioned to
fail
7
Earthquake- and rainfall-triggered landslides
- Highest probability of landslide area is below
detection limit (3600 m2) - Statistics are independent of triggering
mechanism
8
Landslide location and delivery of sediment to
rivers
Chenyoulan River Basin - close to Chi-Chi
epicenter - well instrumented
Typhoon Herb 289 landslides Chi-Chi Earthquake
584 landslides Typhoon Toraji 1,903 landslides
9
Landslide location and delivery of sediment to
rivers
- 1 km2 is critical upslope area for channelized
flow - Area-slope scaling exponent of -0.42 is typical
for river channels (Montgomery and
Foufoula-Georgiou, 1993)
A drainage area of the most downstream point
reached by each landslide (m2) -Calculated using
D8 flow-routing algorithm in ARC/INFO
10
Landslide location and delivery of sediment to
rivers
Chi-Chi Earthquake 8 delivered sediment to
rivers Typhoon Toraji 13 delivered sediment to
rivers Typhoon Herb 24 delivered sediment to
rivers
11
Spatial pattern of river response to the Chi-Chi
Earthquake
C kQb C is sediment concentration (g/L) Q is
water discharge (m3/s) b is strength of relation
between Q and C, and is determined by process of
sediment mobilization (transport capacity or
sediment supply) k is unit sediment
concentration ?k kpost/kpre ?k should be
related to sediment supply by co-sesimic and
storm-triggered landslides
Choshui
Chenyoulan
- post earthquake
- pre earthquake
12
Spatial pattern of river response to the Chi-Chi
Earthquake
- High ?k along Chelunpu fault
- ?k pattern correlates with PGA
13
Spatial pattern of river response to the Chi-Chi
Earthquake
r2 0.86
14
Temporal pattern of river response to the Chi-Chi
Earthquake
- Post earthquake erosion rates are lower in
winter and years with no typhoons (eg. 1999) - Channel sediments were depleted rapidly after the
Chi-Chi earthquake - Hillslopes deliver sediment to rivers during
typhoons
15
Hyperpycnal Flows
pw is the density of seawater pf is the density
of river plume pf gt pw
Salinty and water temperature require C of
36-40 g/L
16
Hyperpycnal Flows
Stratigraphic indicator of increased tectonic
activity
17
Conclusions
- Suspended sediment concentrations increased 4X
following the Chi-Chi earthquake - Typhoons mobilize stored co-seismic sediment on
hillslopes. Travel time is dependent on typhoon
frequency. - Hyperpycnal flows can be stratigraphic indicators
of tectonic activity
18
(No Transcript)
19
(No Transcript)
Recommended
CrystalGraphics Presentations


