
A statistical downscaling model for southern Australia winter rainfall
1 / 40
Title:
A statistical downscaling model for southern Australia winter rainfall
Description:
Antarctic Oscillation or Southern Annular Model (SAM)- the dominant mode of ... Predicted (red dash curve) versus observed JJA rainfall amounts (black solid ... –
Number of Views:63
Avg rating:3.0/5.0
Title: A statistical downscaling model for southern Australia winter rainfall
1
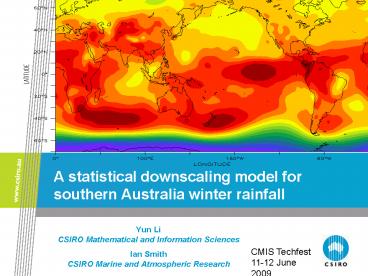
A statistical downscaling model for southern
Australia winter rainfall
- Yun Li
- CSIRO Mathematical and Information Sciences
- Ian Smith
- CSIRO Marine and Atmospheric Research
CMIS Techfest 11-12 June 2009
2
Antarctic Oscillation or Southern Annular Model
(SAM)- the dominant mode of variability in SH
The AAO upward trend may play a role in the
winter extreme rainfall decrease in SWWA. Li et
al. (2005), Journal of Climate
3
Acknowledgement
- Indian Ocean Climate Initiative
- CSIRO Climate Adaptation Flagship
- CSIRO Water for a Healthy Country Flagship
- Australian-China Climate Change Partnership
Program - Mark Collier (CMAR) for providing the CSIRO MK3.5
GCM data - Wenju Cai (CMAR)
- Ming Feng (CMAR)
- Quanxi Shao (CMIS)
- You-Gan Wang (CMIS)
- Harri Kiiveri (CMIS)
4
Outline
- Motivations
- Statistical downscaling models based on Principal
Component Regression (PCR) Model - Downscaling large-scale MSLP modes to JJA
rainfall over southern Australia using PCR model - Conclusions
- Ongoing work
5
Motivation 1
- Precipitation fields from current Global
Circulation Models (GCMs) are mostly
inappropriate for directly application because of
the limited representation of regional orography
and poor representation of mesoscale processes
in GCMs (Cohen, 1990 J. Schmidli, C. Frei and P.
L. Vidale 2006) - Most GCMs can simulate the SLP modes better than
they can simulate rainfall (Santos et al. 2005). - Future climate change projections has the
relatively large uncertainty that characterizes
estimates of future changes in rainfall at the
regional scale. - Uncertainties in projected rainfall changes for
later this century plague estimates of impacts on
future runoff and water storages (Milly et al.
2008). - One means of reducing this problem is to
statistically downscale the coarse scale results
from climate model simulations using, where
possible, variables that are known to be strongly
linked to rainfall.
6
Example NCEP JJA rainfall not only
underestimates SWWA JJA rainfall but also gives
the wrong trend
7
Motivation 2 Investigate large scale SLP modes
and winter regional rainfall
- SWWA
- SA
- (3) VIC
- (4) TAS
Aim A hybrid statistical-dynamic approach to
downscale large-scaled MSLP modes from GCMs to
regional rainfall.
8
Data
- Observed SWWA, SA, VIC and TAS rainfall, Bureau
of Meteorology - Grid rainfall over Australia, Bureau of
Meteorology - NCEP Mean Sea Level Pressure (MSLP)
- CSIRO Mk 3.5 GCM simulated MSLP
- Antarctic Oscillation and SOI
9
NCEP SLP Grid point data (2.5x2.5 degree)
10
Principal Component Regression (PCR) model
Linear Model
EOF
Choose using cross-validation
PCR Model
Predication
11
Australian region MSLP modes/patterns represented
by the first eight PCs
12
The standardized PC time series (Z1-Z8)
13
Correlation between Southern Hemisphere MSLP and
each PC time series
14
Correlation between the first 8 JJA MSLP modes
and both the SOI and the SAM index (1948-2005).
15
Correlations between rainfall and principal
component time series
16
Bootstrap assessment of significant correlations
between the eight leading PC score series and JJA
rainfall.
17
Select components in PCR model
18
The relative contribution (in mm) of each of the
first four MSLP modes to regional winter rainfall
totals in terms of the regression coefficients of
PCR models
The boxes and thin horizontal lines represent the
50 and 95 confidence intervals respectively
19
Predicted (red dash curve) versus observed JJA
rainfall amounts (black solid curve) for each of
the four regions.
20
Predicted (red dash curve) versus observed JJA
rainfall amounts (black solid curve) for each of
the four capital cities
21
Spatial variation of DS skills in terms of the
correlation between predicted and observed JJA
rainfall in testing period 1991-2006
22
SLP Climatology from NCEP reanalysis, CSIRO Mk3.5
A2
23
Present day (1971-200) and future (2071-2100) JJA
rainfall totals
o the observed value GCM simulated
values for the present x GCM simulated
values for future periods The boxes and thin
horizontal lines represent the 50 and 95
confidence intervals respectively.
24
Regional JJA mean rainfall for both the present
(1971-2000) and future (2071-2100). A comparison
between observed, GCM simulated, and downscaled
GCM values.
25
Summary
- Climate models tend to underestimate JJA rainfall
and sometimes do not reproduce the observed
trends. - PCR models perform reasonably well at simulating
winter regional-scale rainfall - However, there is considerable variability in
skill when simulating individual station rainfall - PCR models demonstrate a reduction in the errors
associated with estimates for present day
rainfall and a reduction in the magnitude of
estimates for future rainfall changes.
26
Li, Y., and Ian Smith (2009). Journal of Climate
Vol. 22, No. 5. 1142-1158.
27
Further development Linear and Non-linear?
28
Downscaling SWWA winter rainfall using GAM
(nonparametric data-driven approach)
A paper on using the semi-parametric PCR model is
in the writing progress
29
Partial Least Square (PLS) regression model
Linear Model
PLS
Choose using cross-validation
PLS Model
Predication
30
Principal Component Regression (PCR) model
Linear Model
EOF
Choose using cross-validation
PCR Model
Predication
31
PLS or PCR? A on-going work. PLS pattern with
SWWA rainfall
32
MSLP PLS Patterns associated with SA JJA rainfall
33
MSLP PLS Patterns associated with VIC JJA rainfall
34
Comparison between PCR and PLS
Cor0.69 RMSE37
PCR
Cor0.81 RMSE32
PLS
35
Comparison between PCR and PLS
Cor0.61 RMSE25
PCR
Cor0.73 RMSE24
PLS
36
Comparison between PCR and PLS
Cor0.64 RMSE47
PCR
Cor0.77 RMSE38
PLS
37
Comparison between PCR and PLS
Cor0.80 RMSE49
PCR
Cor0.83 RMSE53
PLS
38
Summary of ongoing work
- PCR downscaling skill can be improved by
semi-parametric models. - PCR downscaling skill can be improved by PLS
regression model, with more difficulties on the
interpretation of MSLP mode represented by PLS
loadings. - Alex Stuckeys PhD thesis Statistical Estimation
in Single-Index Spatial Time Series Models
39
Thank you and welcome your comments!
Li, Y., and Ian Smith (2009). A statistical
downscaling model for southern Australia winter
rainfall. Journal of Climate Vol. 22, No. 5.
1142-1158.
40
Antarctic Oscillation or Southern Annular Model
(SAM)- the dominant mode of variability in SH
Recommended
CrystalGraphics Presentations


![All New Autumn Winter Baby Clothes [2021]](https://s3.amazonaws.com/images.powershow.com/9612828.th0.jpg?_=20210610098)


