
How to organize data into frequency tables PowerPoint PPT Presentation
1 / 2
Title: How to organize data into frequency tables
1
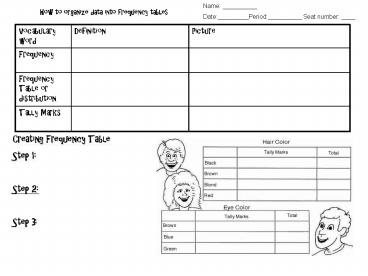
How to organize data into frequency tables
Name __________ Date_________Period__________
Seat number ____
Vocabulary word Definition Picture
Frequency
Frequency Table or distribution
Tally Marks
Creating Frequency Table Step 1 Step 2 Step
3
2
How to make a Line Plot Stem and Leaf Plot
- Line Plot
- Define
- Steps
- Example
- Data Number of MMs in a bag 12, 14, 14, 15,
15, 15, 16, 17, 17, 17, 17, 18, 18, 18, 18, 18,
19, 19, 20, 20, 20, 20, 20, 21, 21, 23
- Stem and Leaf plot
- DefineIn a stem-and-leaf plot each data value is
split into a "stem" and a "leaf". The "leaf" is
usually the last digit of the number and the
other digits to the left of the "leaf" form the
"stem". The number 123 would be split as stem
12 leaf 3 - Steps
- Example
- Data Math test scores out of 50 points 35, 36,
38, 40, 42, 42, 44, 45, 45, 47, 48, 49, 50, 50,
50.
Recommended
