

Long-term Solar Irradiance at the Surface Derived from Satellite Data PowerPoint PPT Presentation
Title: Long-term Solar Irradiance at the Surface Derived from Satellite Data
1
Long-term Solar Irradiance at the Surface Derived
from Satellite Data
Istvan Laszlo1(GOVERNMENT PRINCIPAL INVESTIGATOR)
, Hongqing Liu2 1NOAA/NESDIS/STAR/SMCD, 2DPSGS
- Requirements
- Describe and understand the state of the climate
system through integrated observations, analysis,
and data stewardship. - Conducting observational, diagnostic, and
modeling research to improve understanding of
physical mechanisms and processes of climate
variability and predictability that will lead to
improved climate models and climate predictions. - Science How does the solar radiation available
at the surface respond to changes in atmospheric
and surface conditions? - Benefit NCEP and the climate modeling community
will have accurate surface solar radiation
products that provide observational constraints
for climate models, and better quantify the
effect of changes in the climate system.
Analysis of Surface Solar Radiation Trends
-Results
21-year Average Surface Solar Radiation
Data and Method
- Data source International Satellite Cloud
Climatology Project (ISCCP) D1 - State of the art long-term radiance and cloud
data since July 1983 - Spatial/temporal resolution 280-km equal area/3
hours (nominal) - Satellite source Operational polar and
geostationary satellites including those of NOAA - Algorithm Version 3 of the Satellite Algorithm
for Shortwave Radiation Budget (SASRAB-V) is
applied to the ISCCP D1 radiances for retrieving
the shortwave (SW 0.2-4.0 m) irradiance at the
surface. - Retrievals are compared to two other,
independently derived records of the SW surface
irradiance variability of radiation with time is
analyzed.
- The three datasets differ in the magnitude of
trend and the number of years needed to detect a
trend. - Differences are larger in the 83-86 period.
- Order of anomalies are reversed at the beginning
and at the end. - The Pinatubo anomaly in GEWEX-SRB is the
smallest. - Trend (T) Wm-2/decade 95 CI 95 confidence
intervals Yrs number of years needed to detect
Trend with probability 0.9. - Positive T TSASRAB gt TGEWEX gt TISCCP
- However, 95 CIs are large trends are not
statistically significantly different. - In some cases, the length of the record is not
enough to detect the calculated trend. - Equatorial (20S-20N) trends are larger than
global ones. - Hemispheric differences are the largest in
GEWEX-SRB. - NH trends in GEWEX and SASRAB are larger than SH
it is the opposite in ISCCP (but large CI(!))
Main features of algorithms used for the retrieval of SW surface irradiance data Main features of algorithms used for the retrieval of SW surface irradiance data Main features of algorithms used for the retrieval of SW surface irradiance data Main features of algorithms used for the retrieval of SW surface irradiance data
SASRAB-V ISCCP-FD GEWEX-SRB
Radiances ISCCP-D1 ISCCP-D1 ISCCP-DX averaged to 1ox1o
Retrieval Delta-Eddington RT NASA GISS climate GCM RT LUT from delta-Eddington RT
Water vapor ISCCP-D1 NOAA TOVS GEOS-4
Ozone ISCCP-D1 TOMS TOMS
Aerosol Tegen et al. monthly climatology NASA GISS CM OPAC
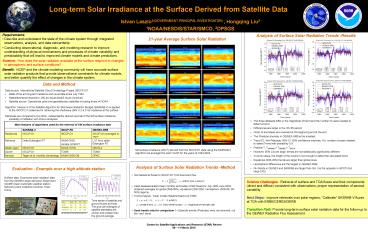
SW surface irradiance (Wm-2) derived from the
ISCCP D1 data using the SASRAB-V algorithm are
averaged for each month for the years of
1984-2004.
Analysis of Surface Solar Radiation Trends -Method
Evaluation - Example over a high altitude station
- Normalized all fluxes to ISCCP-FD TOA downward
flux - Used deseasonalized mean monthly anomalies of SW
fluxes for July 1983-June 2004 obtained averages
for global (50S-50N), equatorial (20S-20N),
hemispheric (50S-0S 0N-50N) regions - Trend Analysis linear model (Weatherhead et
al.1998) - Used trends only for comparison ! Episodic
events (Pinatubo) were not removed not the
real trend.
Surface data Downward solar radiation data from
the GEWEX Asian Monsoon Experiment (GAME) Asian
Automatic weather station Network (AAN)
collection at Amdo, Tibet, China.
Science Challenges Retrieval of surface and TOA
fluxes and their components (direct and diffuse)
consistent with observations proper
representation of aerosol variability. Next
Steps Improve retrievals over polar regions
Calibrate SASRAB-V fluxes at TOA with
ERBE/CERES/GERB Transition Path Provide
long-term surface solar radiation data for the
follow-up to the GEWEX Radiative Flux Assessment.
Time series of satellite and ground fluxes at
Amdo. The grid-cell averages of satellite
estimates are similar and smaller than the ground
average.
Grass is the dominant vegetation at Amdo. The
ISCCP grid, however, contains complex surface
features grass, savanna, lakes and snow. Surface
elevation also varies significantly.
ISCCP grid cell 4979
Data Mean SD Min Max
Amdo 224 43 145 307
SASRAB-V 215 37 153 307
ISCCP-FD 211 41 137 308
Mean, standard deviation (SD), minimum (Min) and
maximum (Max) in Wm-2.
Recommended

